Performance
The performance feature provides a comprehensive view of your investment portfolio (growth and returns). It empowers you to track your assets, make data-driven decisions, and align your strategies with financial goals.
The Performance module displays details about the performance of a portfolio for the selected time period. It also displays a graphical representation of the portfolio's performance along with the monthly overview.
The Performance module is available as a mock service and is not available as part of the Transact Integration.
UX Overview - Online Banking and Mobile Native App
The UX Overview section provides information about the UX of the Performance module for the Online Banking and the Mobile Native App.
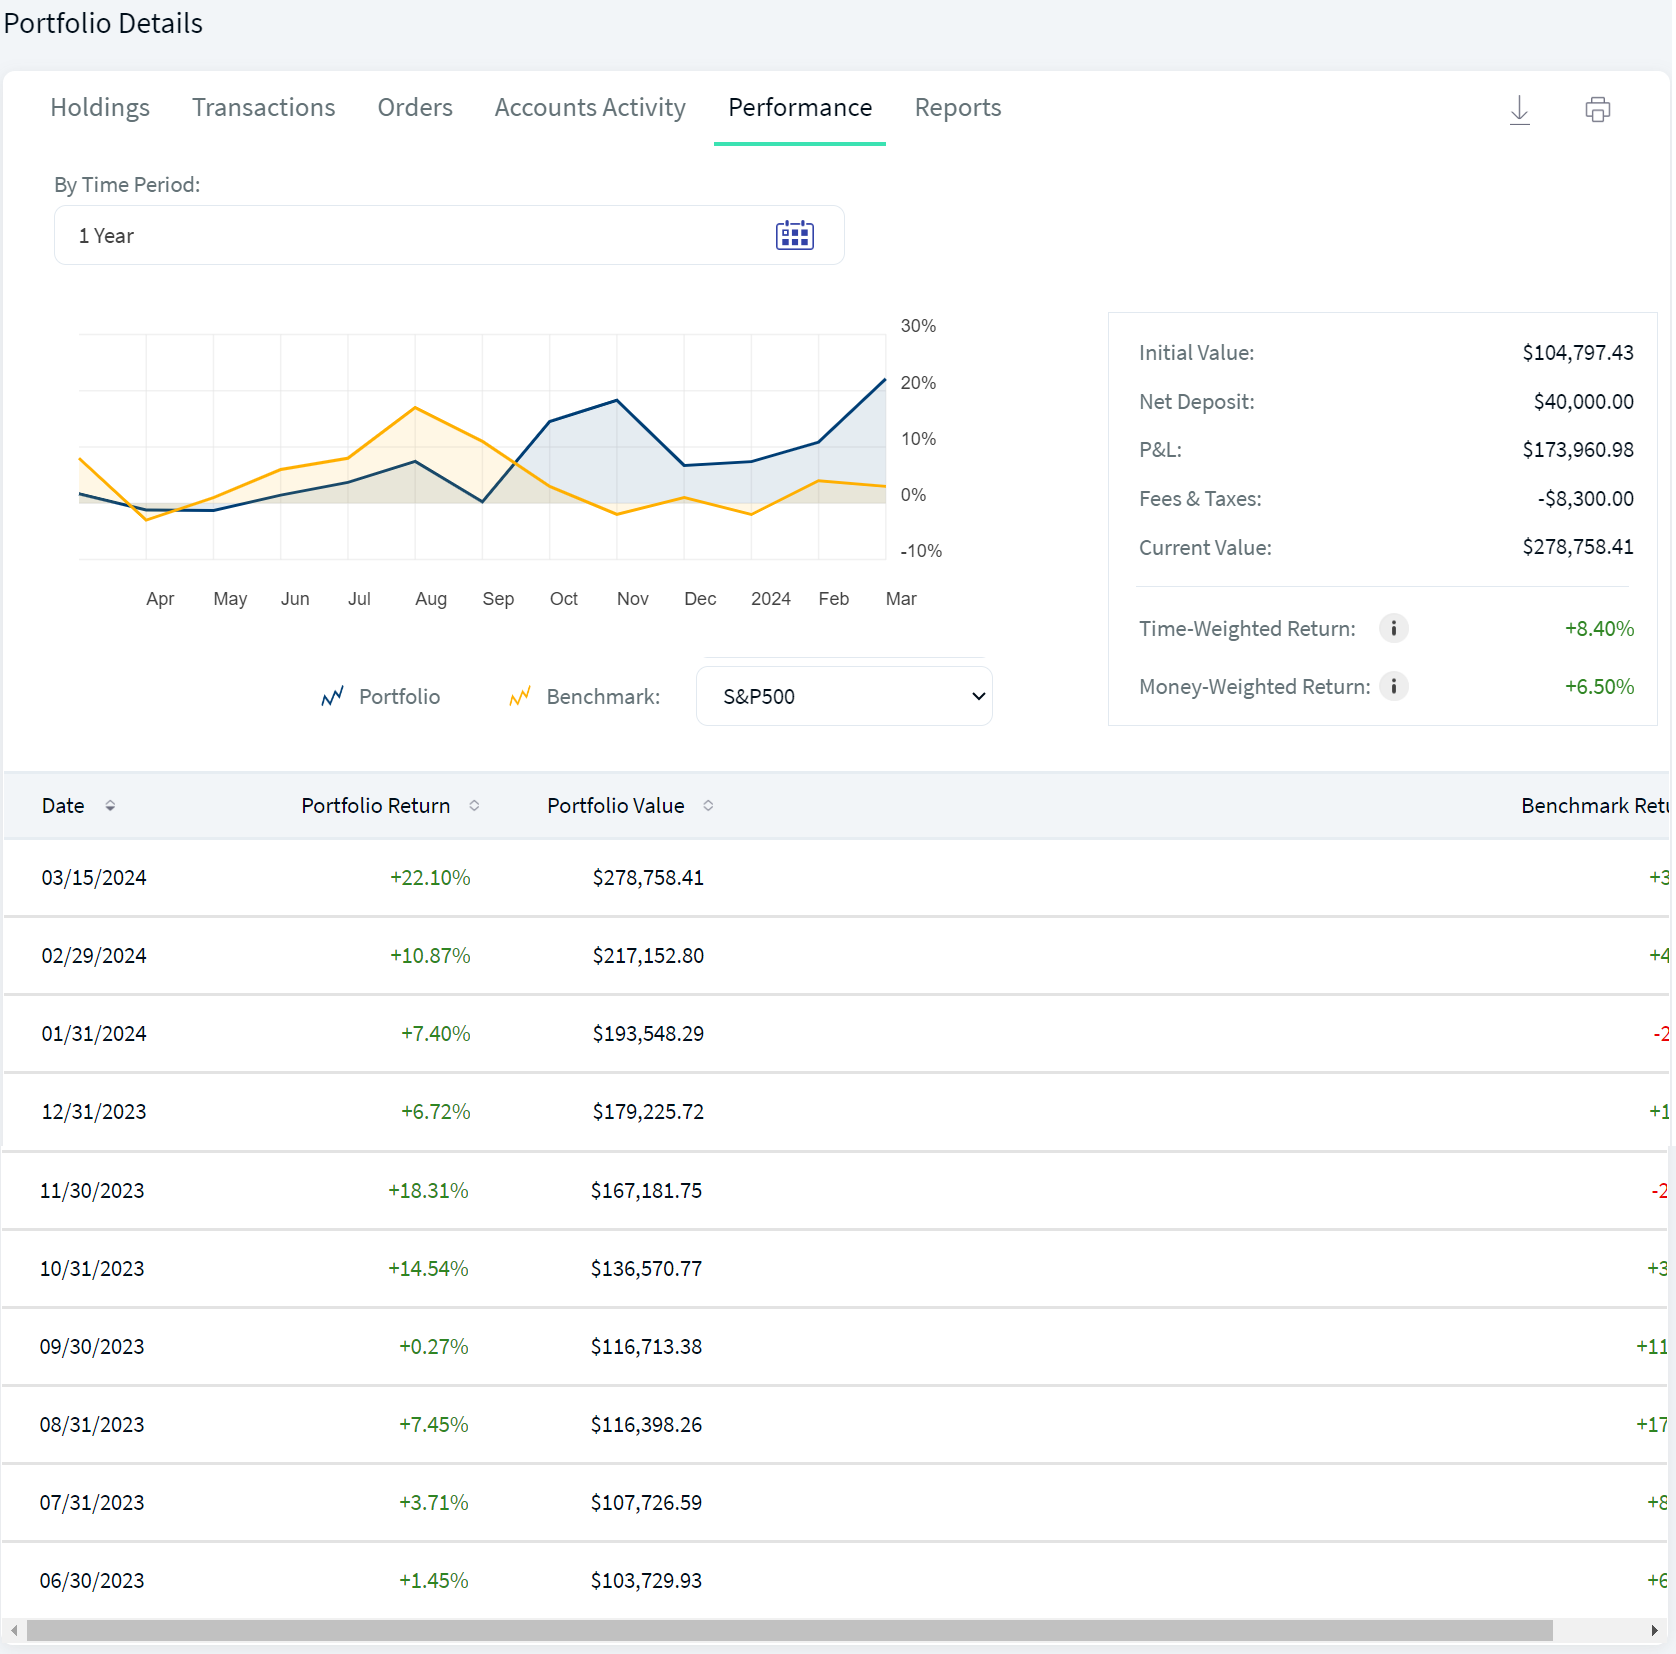
The table below provides an overview of the features, the component information, and the configurable elements.
| Section | Component | Configurable Elements |
|---|---|---|
|
The first section contains two sub-sections. The first sub-section displays the graphical representation of the portfolio performance.
The second sub-section displays the portfolio details such as Initial Value, Net Deposit, P&L, Fees & Taxes, Current Value, Time-Weighted Return. and Money-Weighted Return. |
You can choose whether the two sub-sections align horizontally or vertically. | |
|
The second section of this screen displays the Monthly Overview of the portfolio performance.
You can view the month-wise performance of the portfolio. |
com.temenos.infinityComponent.portfolioDetails | You can choose the fields that must be displayed in this section. |
| By Time Period: You can select the time period for which you want to view the graphical representation of the portfolio performance. | com.temenos.infinityComponent.datePicker | You can configure the predefined time periods and also choose whether a user can pick a custom date range. |
Sequence Diagram - Performance
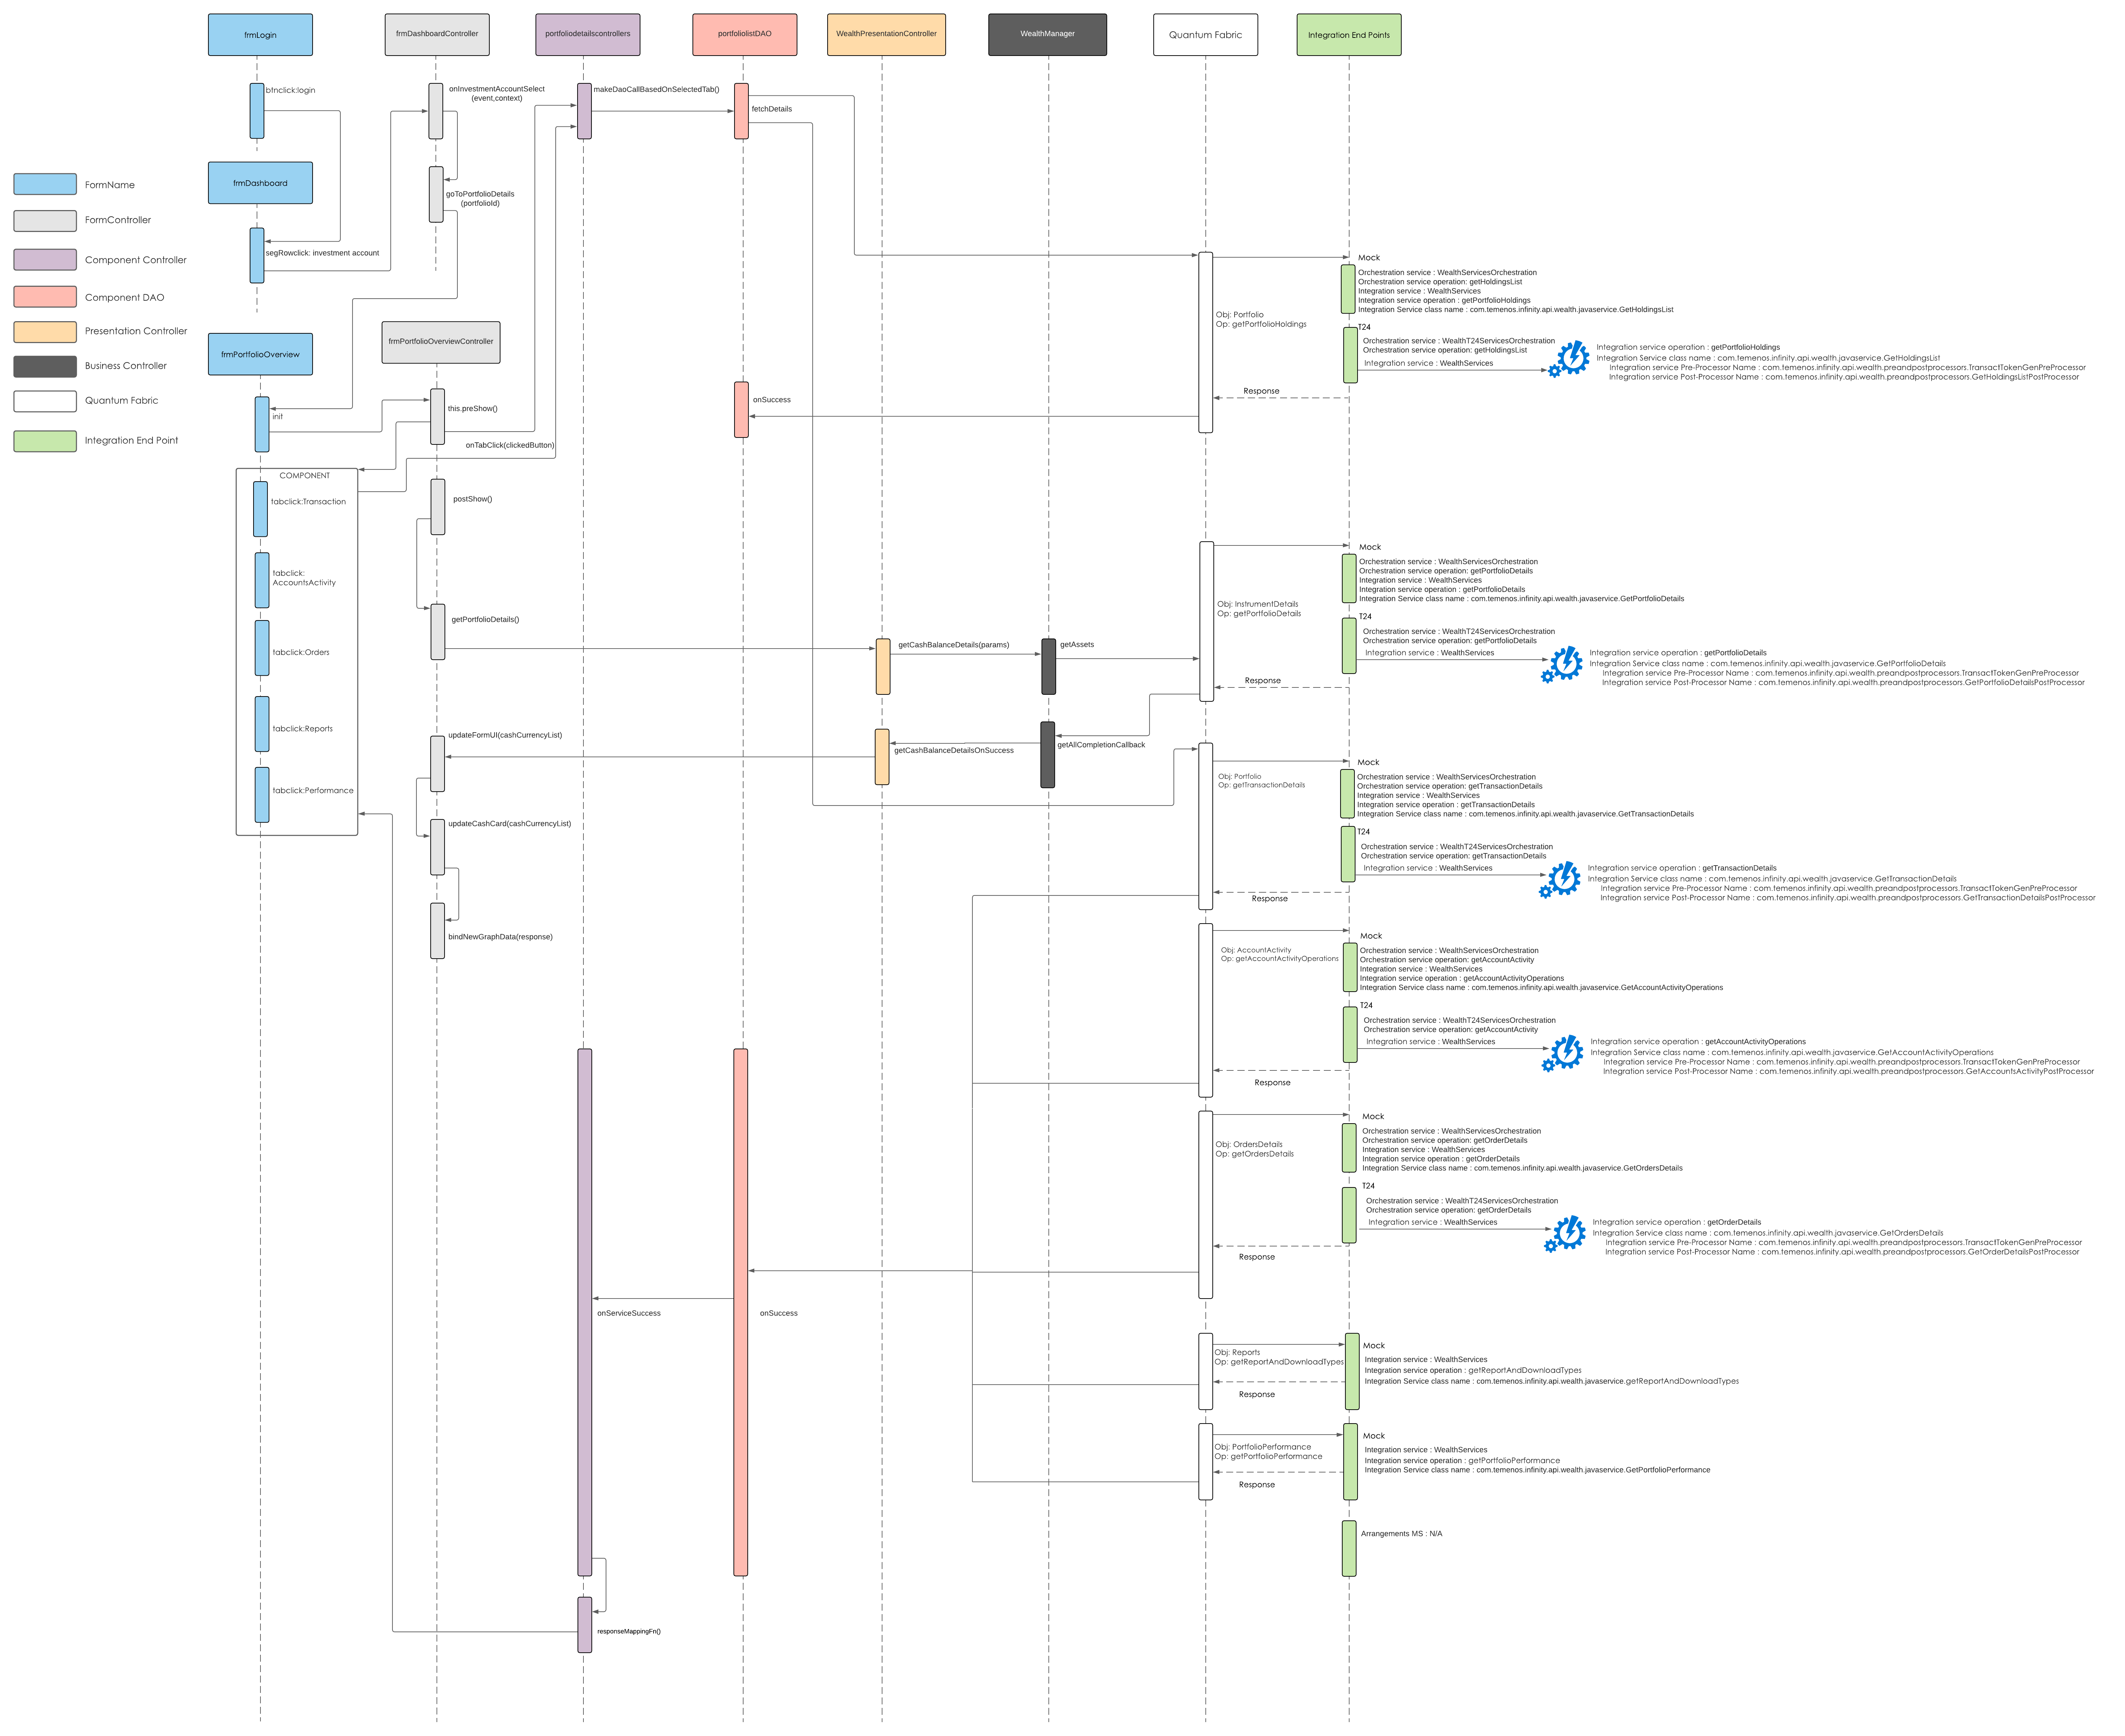
The sequence diagram for Performance is same as that of the Portfolio Details.
Feature Description
Online Banking: The Performance module displays the following details of the portfolio for the selected time period.
- Initial Value: Specifies the initial value of the portfolio.
- Net Deposit: Specifies the net deposit value of the portfolio. It includes both deposits and withdrawals. The Net Deposit value is a consolidated value across all the accounts in the portfolio.
- P&L: Specifies the profit and loss of the portfolio.
- Fees & Taxes: Specifies the total amount of fees and tax that is collected from the portfolio.
- Current Value: Specifies the current value of the portfolio. The latest price changes are also taken into consideration while calculating the current value.
It also displays the following additional details:
- Time-Weighted Return: Specifies the return calculation that eliminates the effects on growth rates that are created by any inflows or outflows of cash. The Time-Weighted Return splits the return into separate intervals based on whether cash is added or withdrawn. It is displayed in terms of percentage.
- Money-Weighted Return: Specifies the return calculation that uses the rate of return, which sets the present values of all cash flows equal to the value of the initial investment. It is displayed in terms of percentage.
For the time periods without cash flows, money-weighted return and time-weighted return are equal.
The mentioned details can be viewed for a selected time period. The predefined time periods are as follows:
- The Last Year (1Y): The graph displays the details for the last year from the current day.
- Year to Date (YTD): The graph displays the details from the beginning of the year to the current day.
- Since Inception: The graph displays the details from the day the total value for the portfolio was available.
You can also select the dates as desired from the Calendar.
For more information about the portfolio performance, the Performance module provides the following sections:
Chart
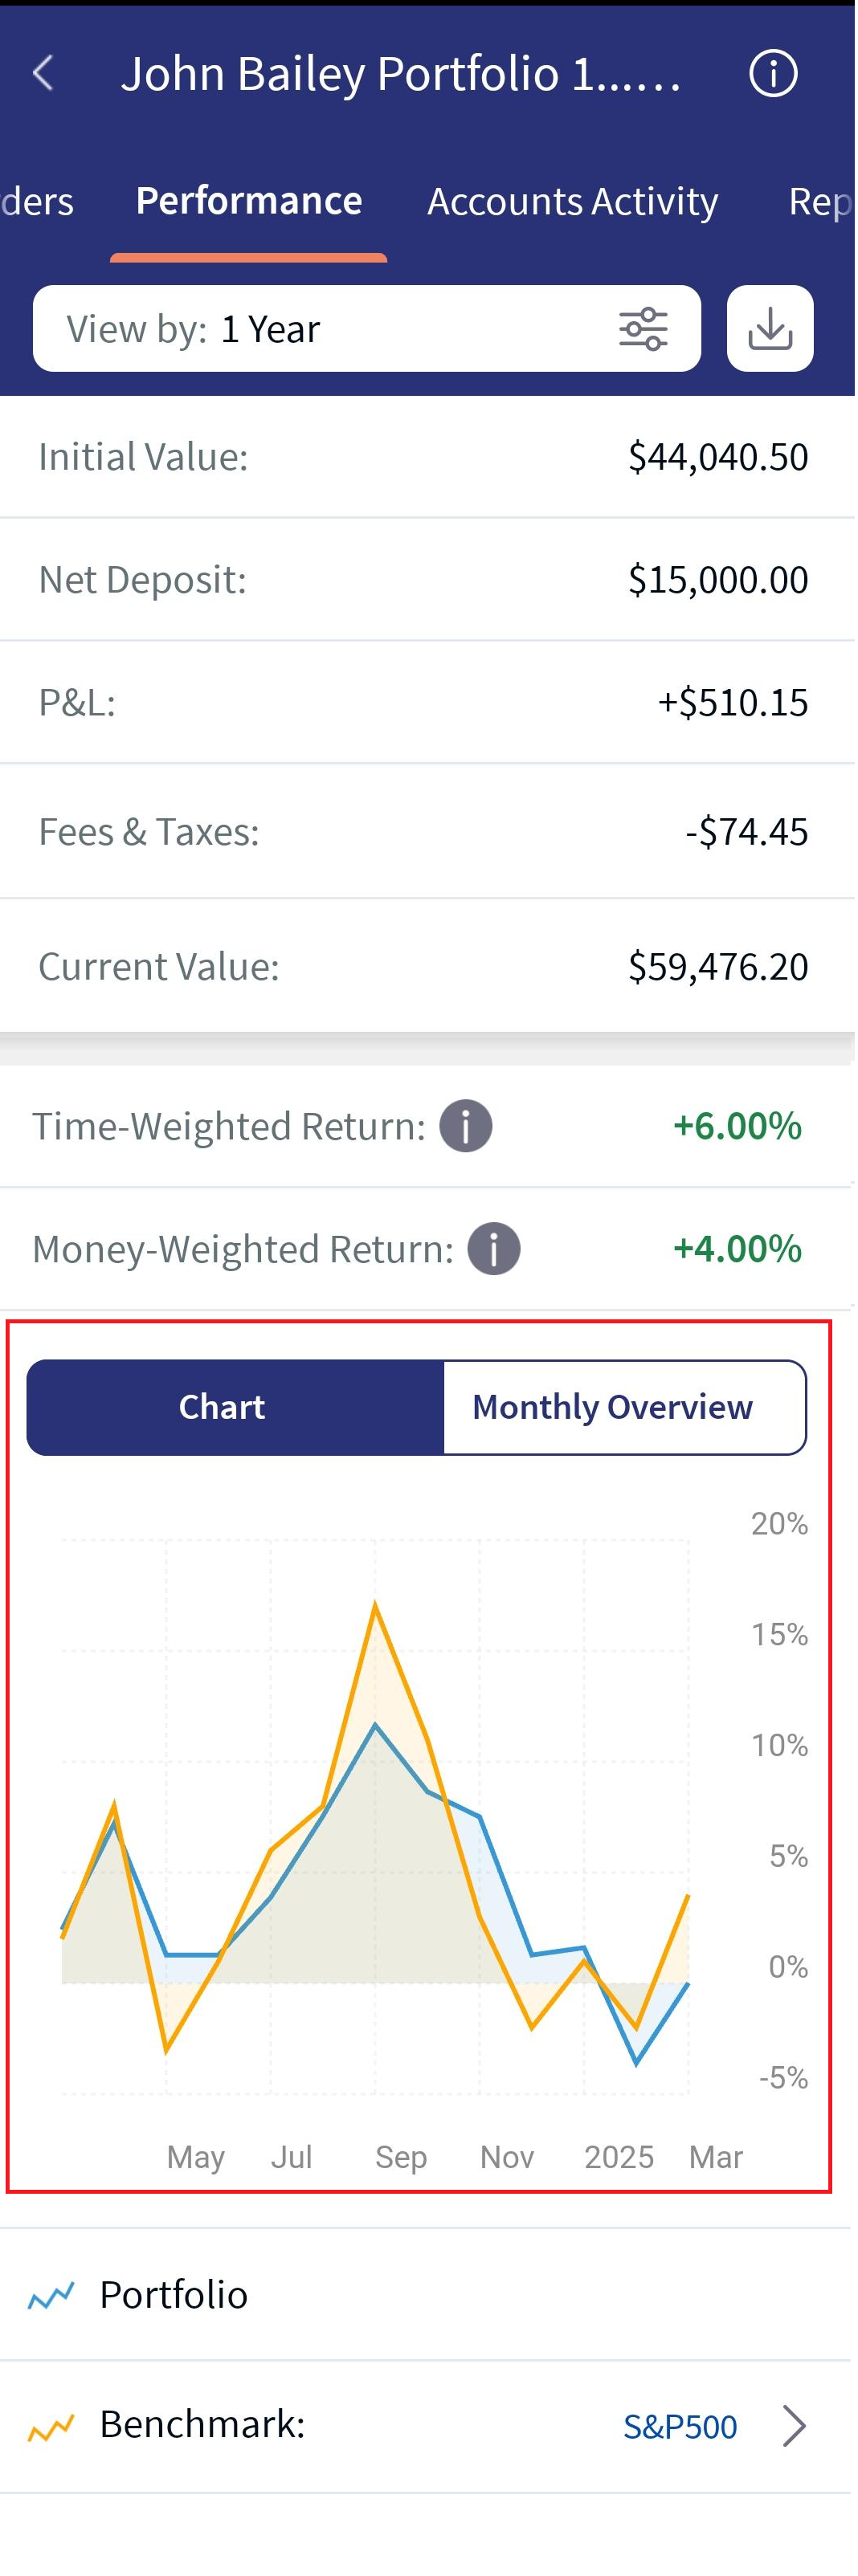
The Chart section provides a graphical representation of the performance of a portfolio. It displays the Portfolio Returns against the Benchmark Index.
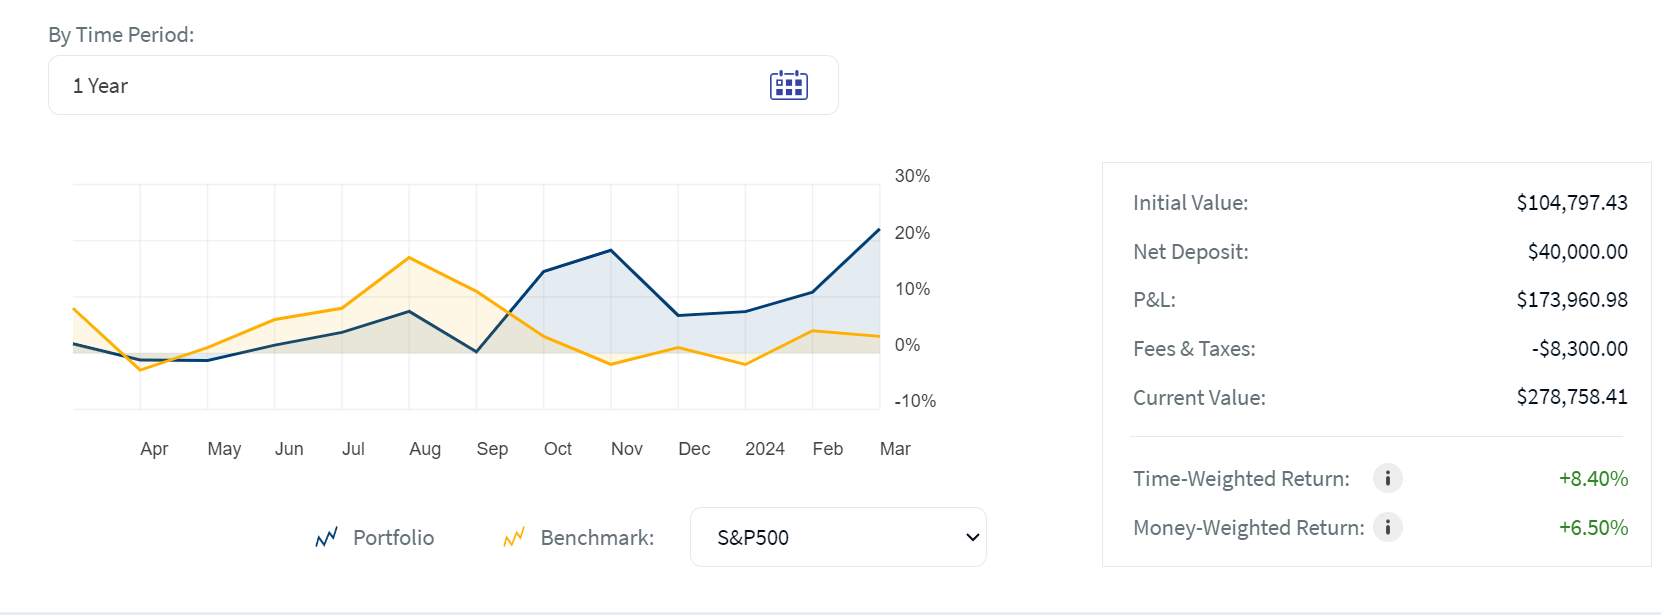
The X-Axis represents the Time Period and the Y-Axis represents the Portfolio Returns.
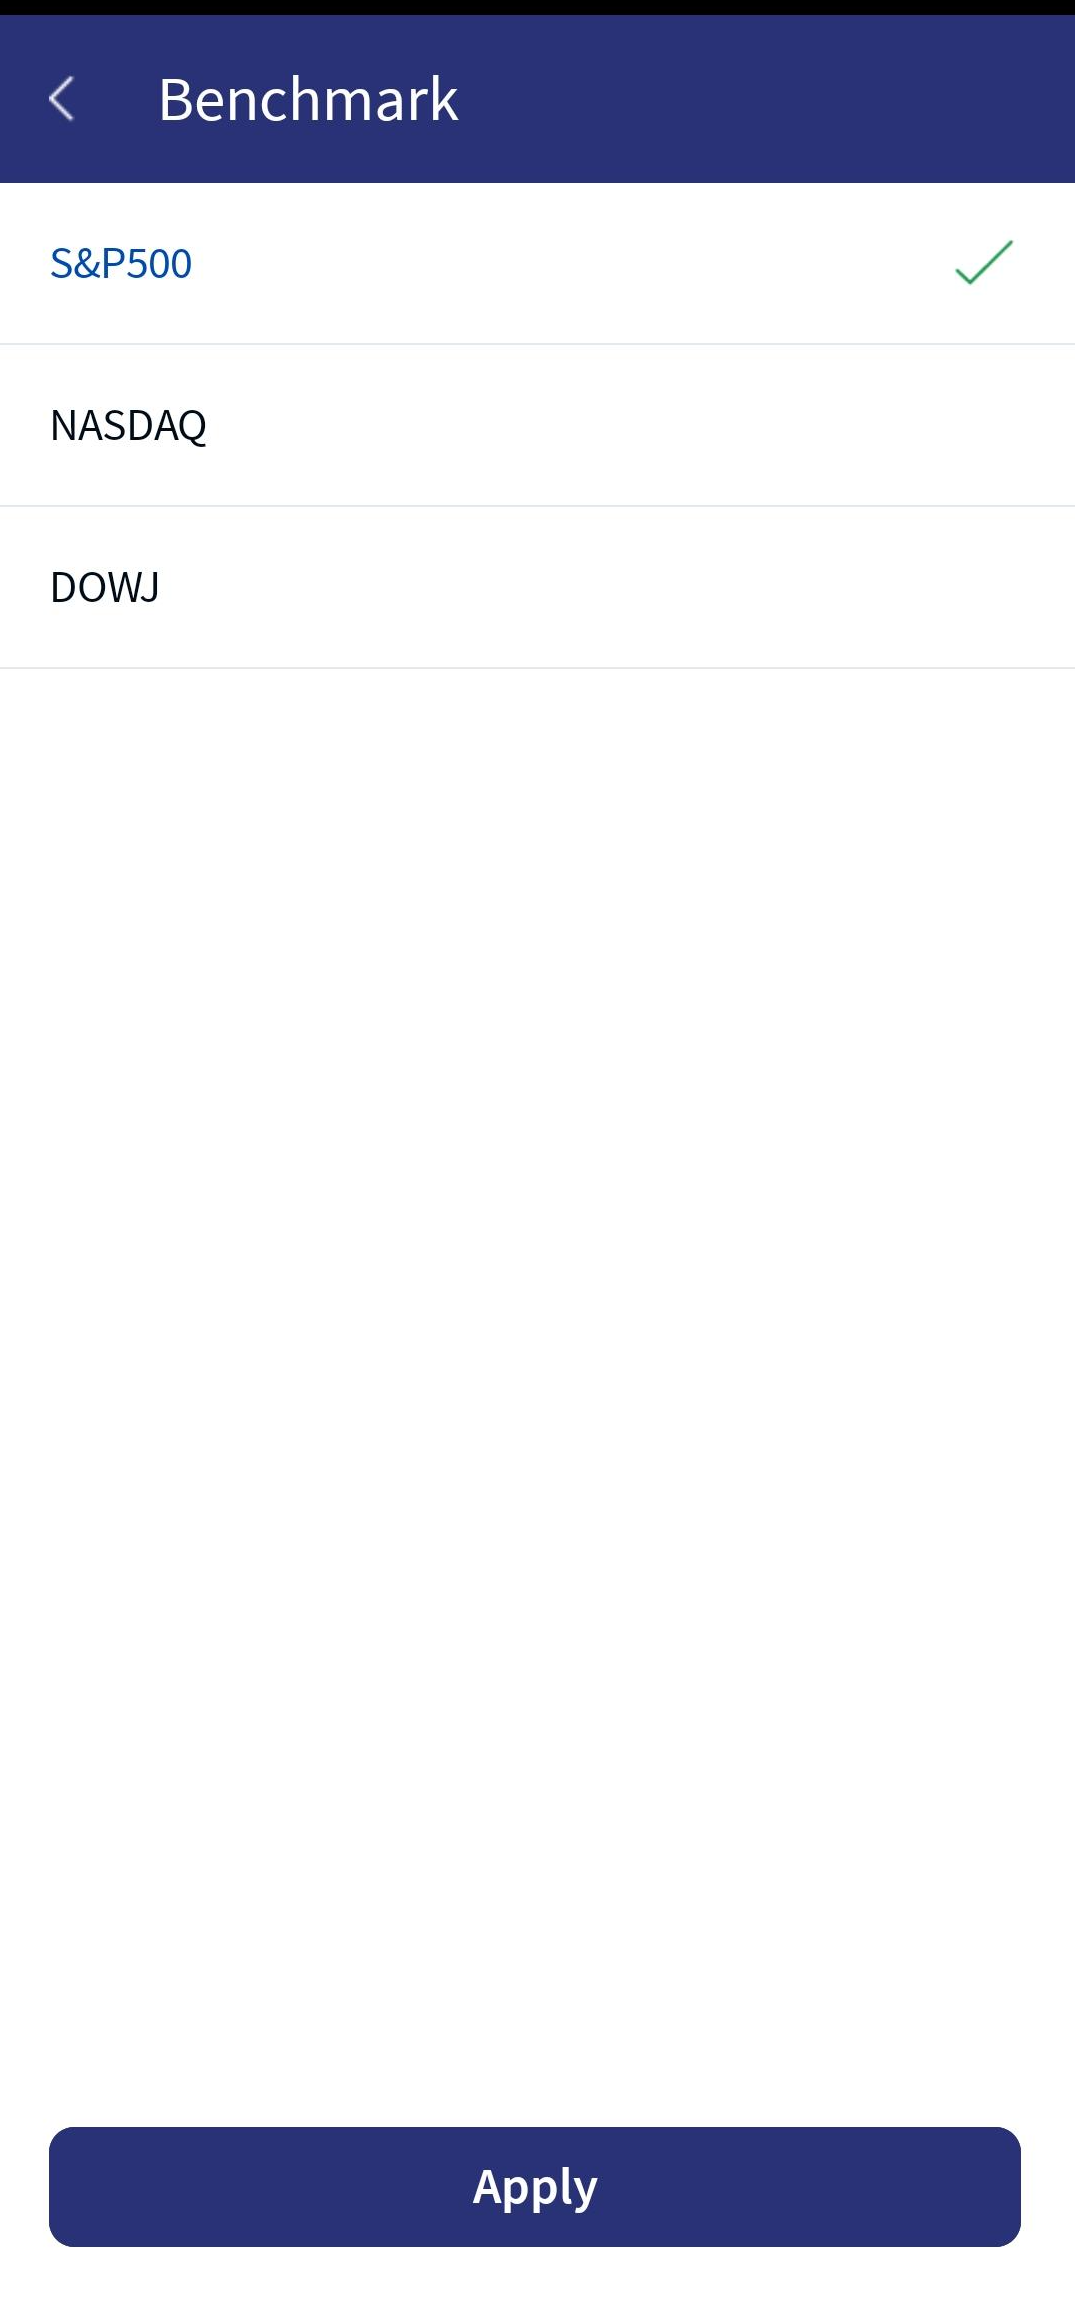
You can configure the Benchmark Index by using the Benchmark option. You cannot select more than one benchmark index.
You can also configure the time period for which you want to view the portfolio performance by using the Portfolio option. When you click the Portfolio option, a Calendar appears where you can select the time period.
Monthly Overview
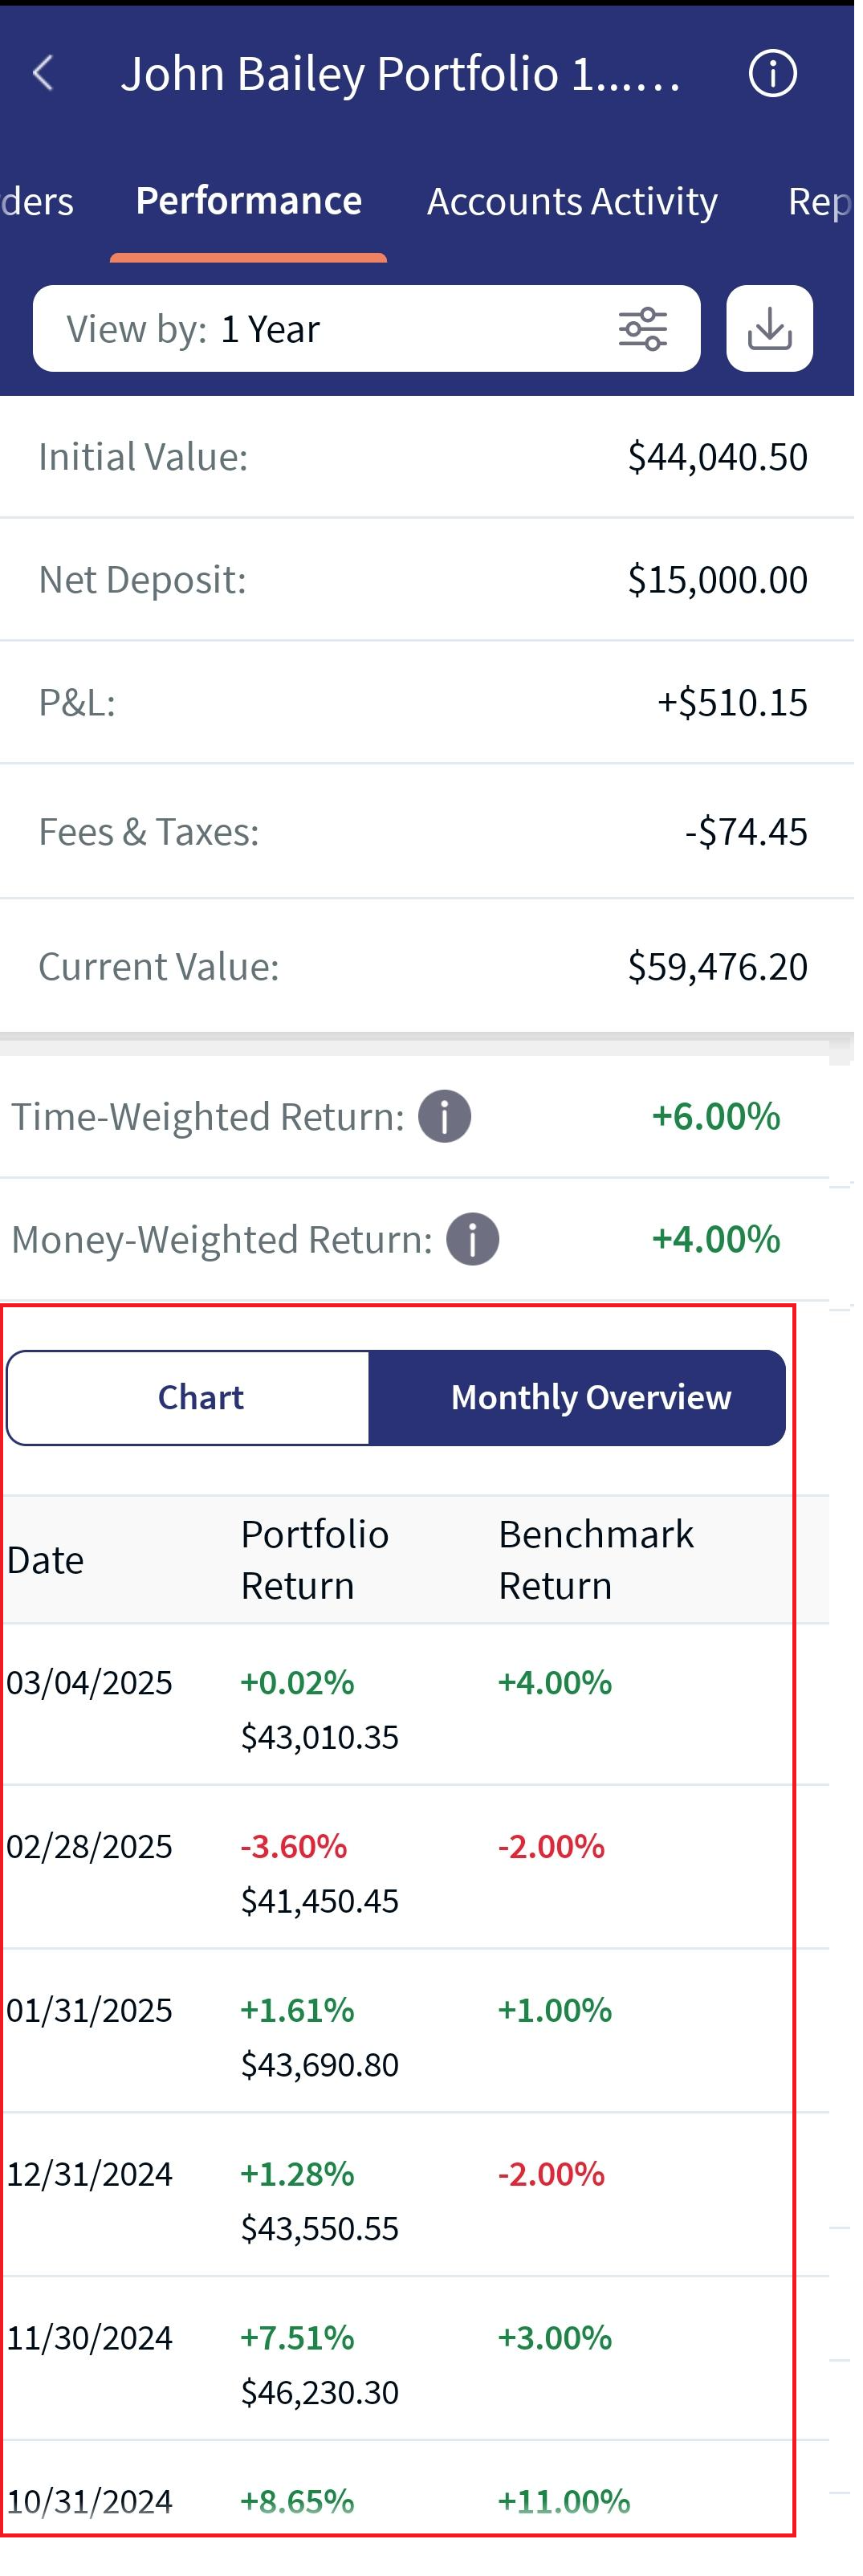
The Monthly Overview section displays the month-wise overview of your investments. You can use this information to review your investments.
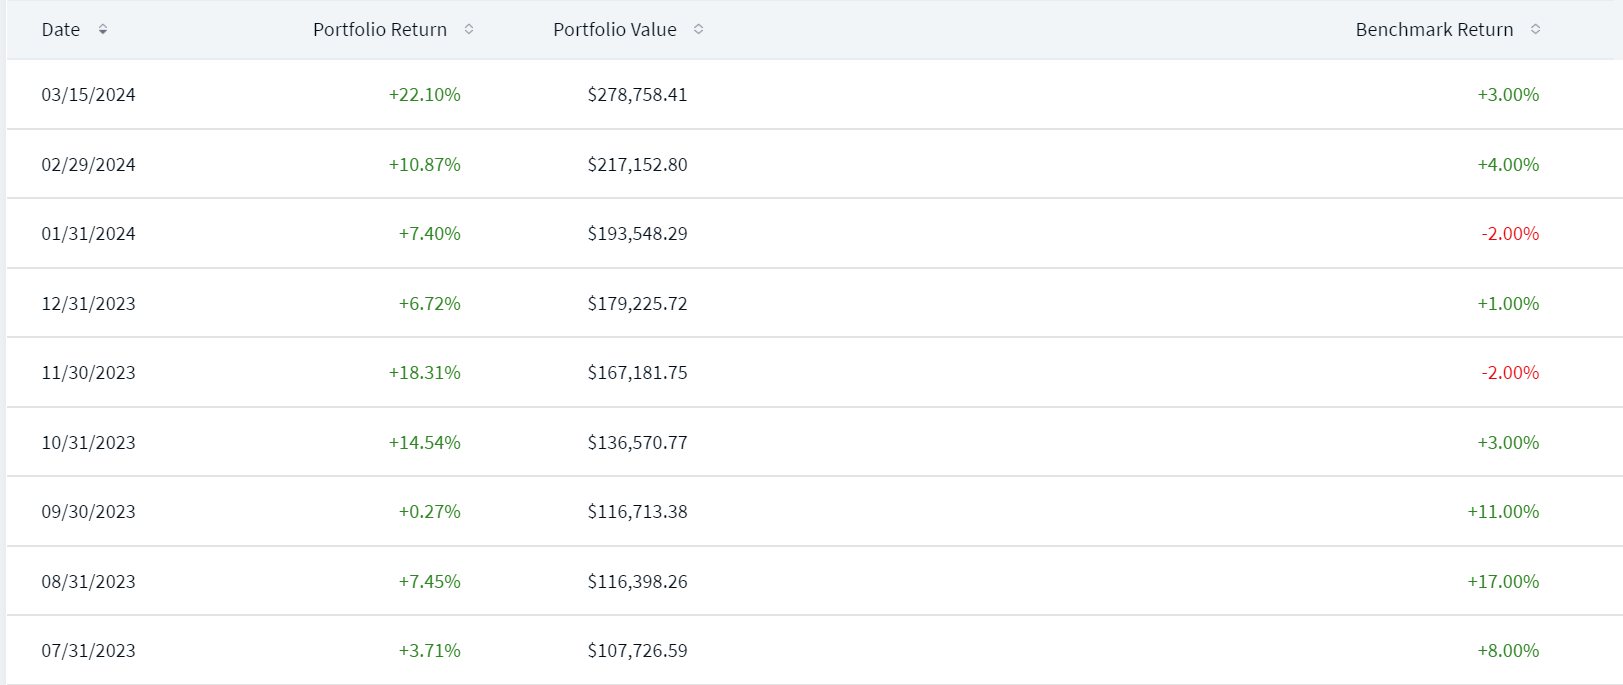
It displays the following details:
- Portfolio Value: Specifies the value of the portfolio on the specific date. It could be either positive or negative.
- Portfolio Return: Specifies the portfolio return on the specific date. It is displayed in terms of percentage and it can be either positive or negative.
- Benchmark Return: Specifies the benchmark return on the specific date. It is displayed in terms of percentage and it can be either positive or negative.
The data is displayed based on the Benchmark Index that you selected in the Chart section. You can change it from the Chart section and the date is displayed accordingly in the Monthly Overview section.
You can perform the following actions on the Performance tab:
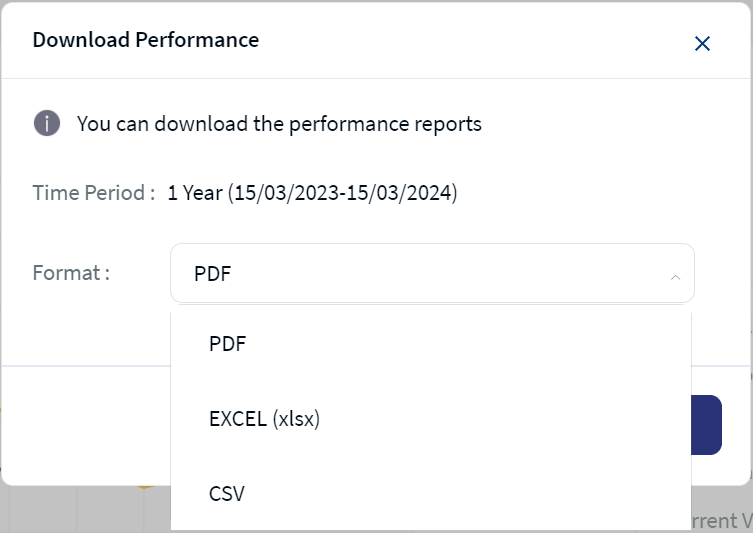
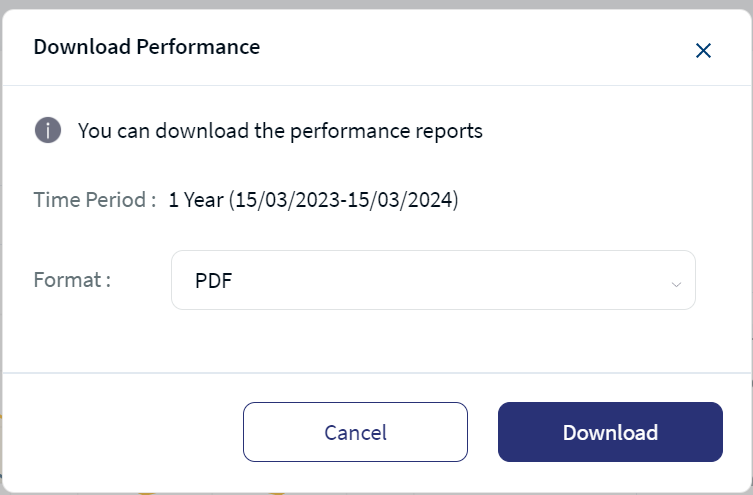
- Download: This option lets you download the performance details by using the download icon. Click the download icon, select Format from the drop-down list, and then click on Download. Based on the defined time period, the system auto-downloads all the details in the selected format to your local system. The downloaded file is password protected. For more information, click here.
- Print: This option lets you print the performance details by using the Print icon. Click the Print icon, and the Print window appears.
- Sort: This option lets you sort the month-wise performance details by a parameter. To do so, click the sort icon adjacent to the desired parameter.
The performance details are sorted by Date, by default.
- You can choose the number of entries that you want to view per page. To do so, select the desired option from the drop-down. The available options are 10 Per Page, 20 Per Page, 50 Per Page, and 100 Per Page.
- Pagination: This option lets you go to the next page of the entries if any.
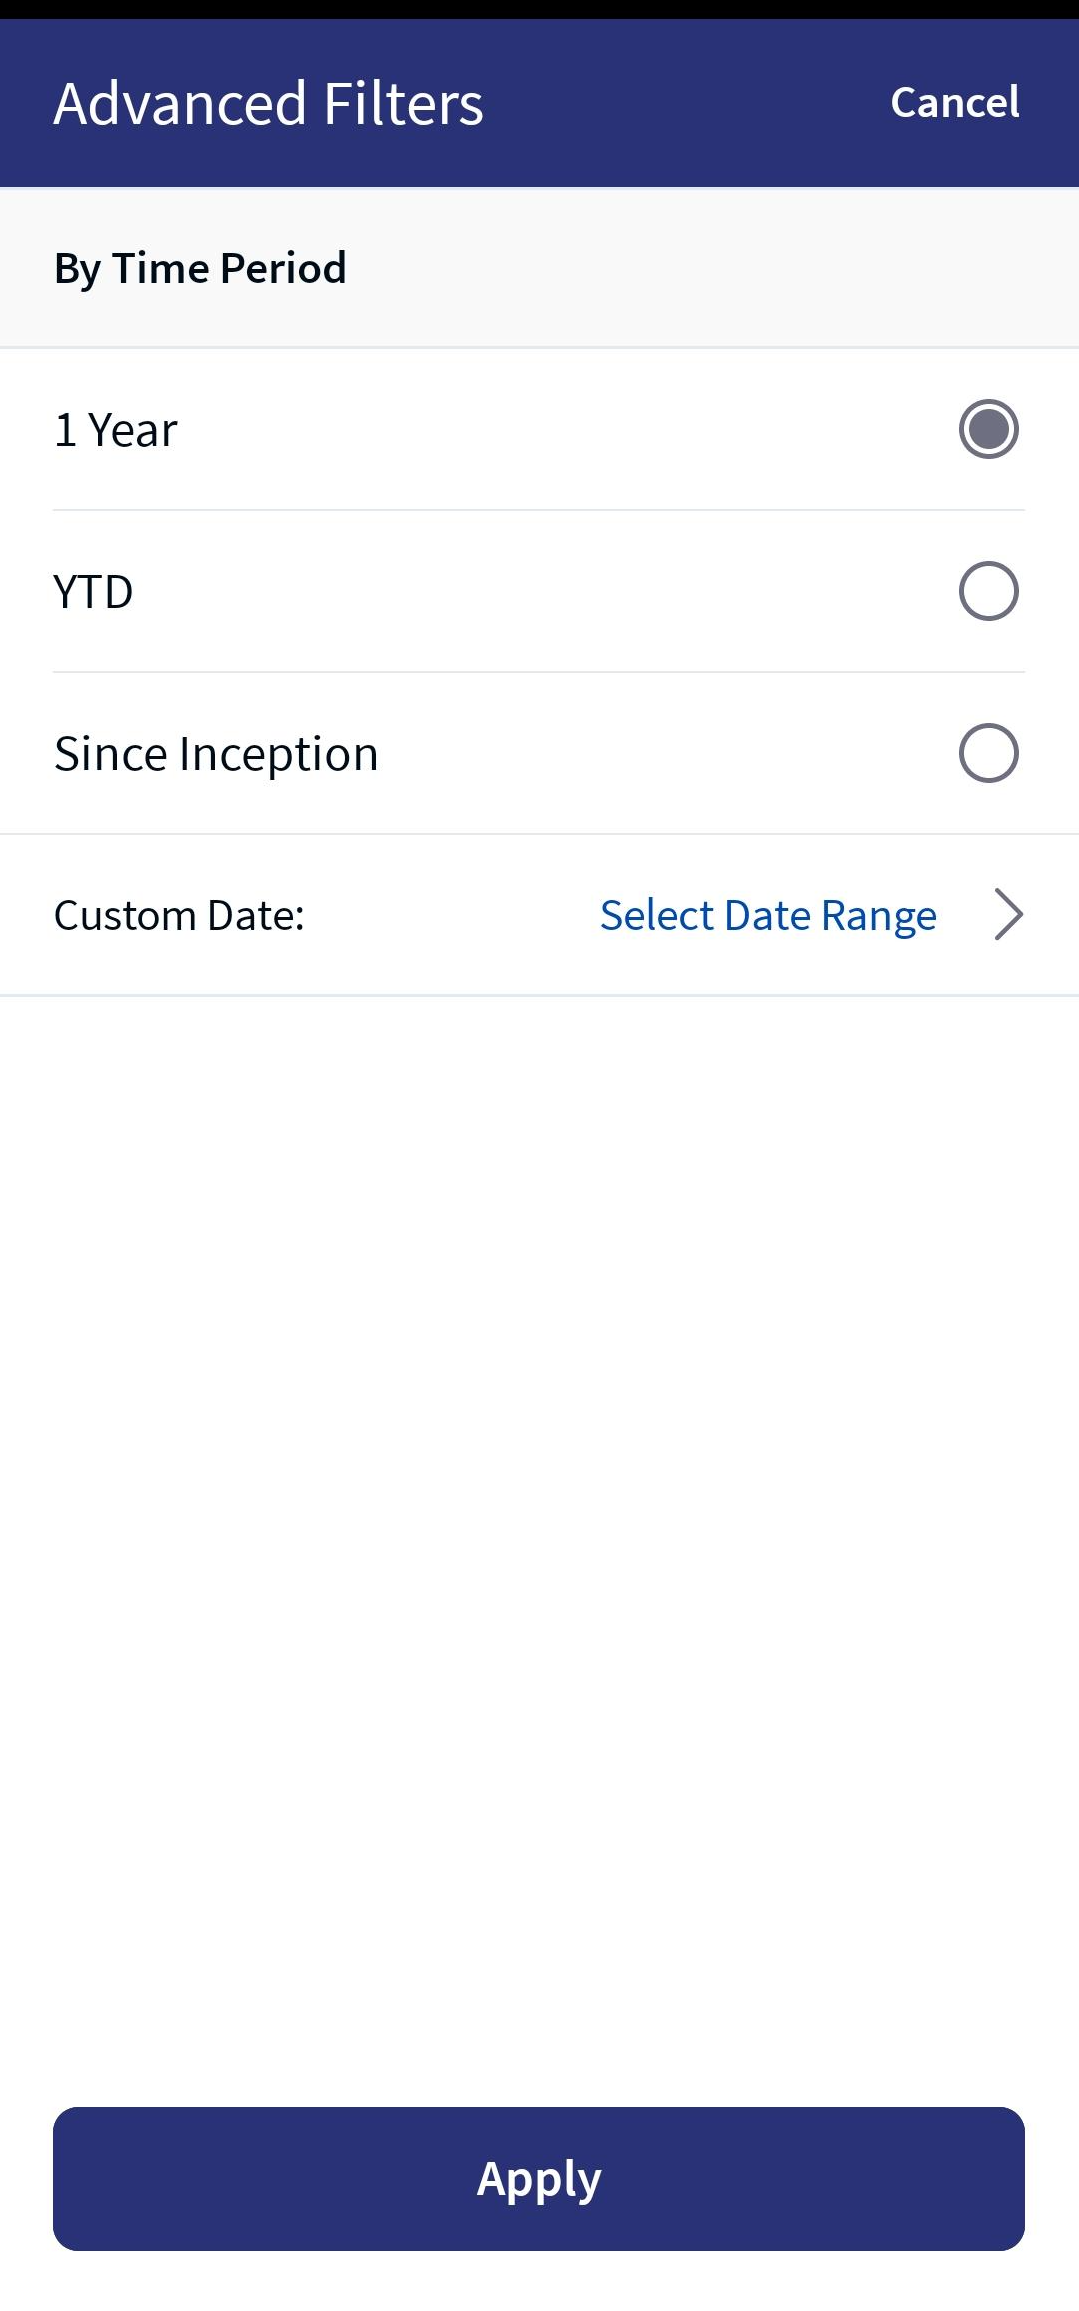
- Filter by Time Period: You can also define the time period over which the orders must be displayed. The predefined time periods are as follows:
- 1 Year: The graph displays the details for the last year from the current day.
- Year to Date (YTD): The graph displays the details from the beginning of the year to the current day.
- Since Inception: The graph displays the details from the day the total value for the portfolio was available.
You can also select a custom date range. The time period is set to 1 Year, by default.
The download feature supports PDF, Excel, and CSV formats.
Mobile Native App:The performance feature appears in the header tab for a portfolio. It displays the performance details for a selected portfolio and the selected period, such as initial value, net deposit, P&L, fees and taxes, and the current value. For a detailed description of each parameter, click here.
In addition, it displays the time-weighed return and money-weighted return details for a selected period. For a detailed description of time-weighed returns, money-weighted returns, and the predefined time frames, click here.
The below pop-up screens are displayed when you click on icon beside the time-weighed return and money-weighted return fields
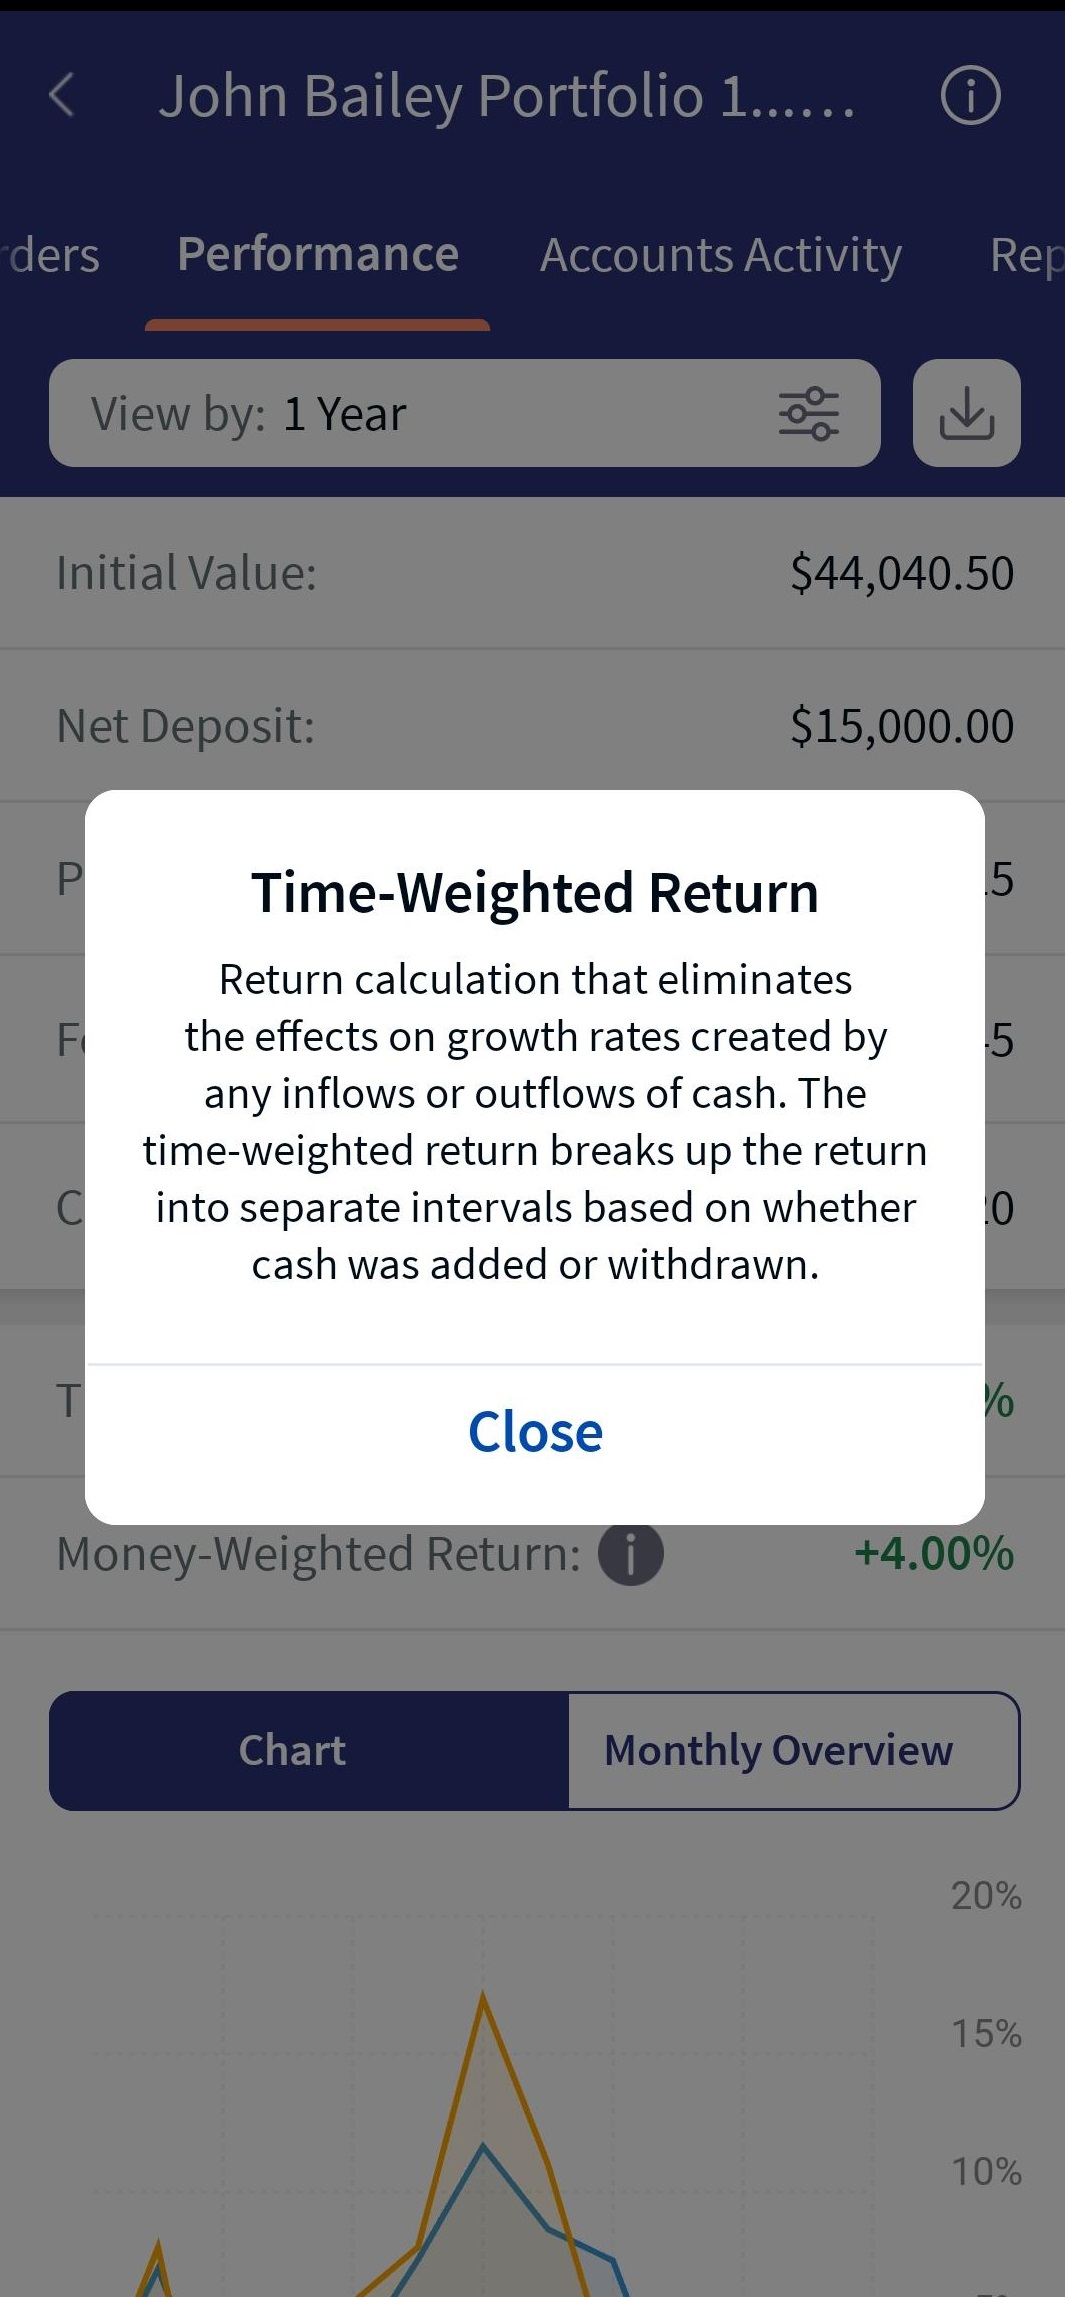
Time-Weighed Return Pop-Up
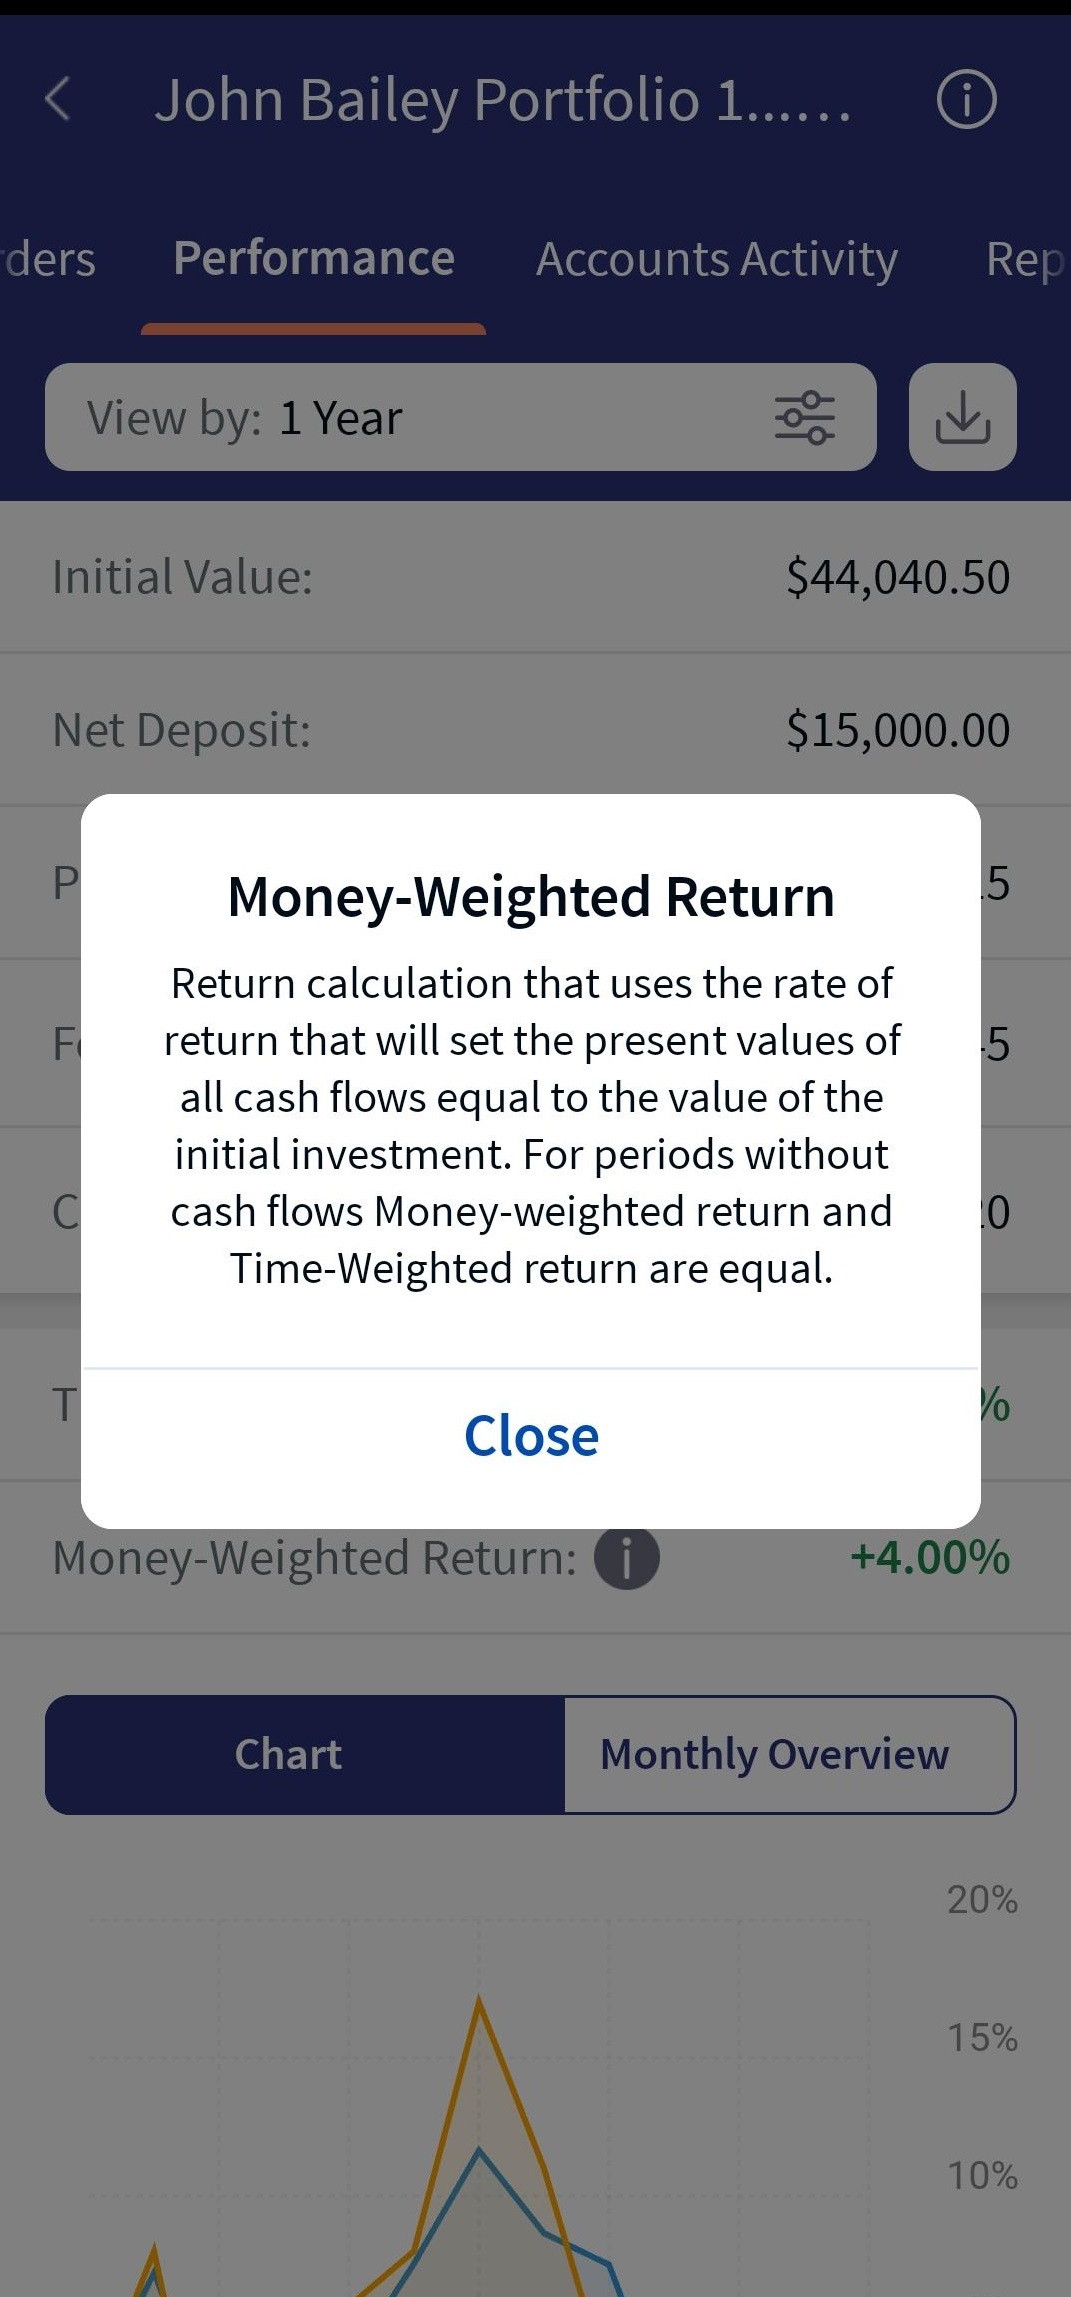
Money-Weighed Return Pop-Up
You can find the portfolio performance in the chart and month-wise, which are categorized in different tabs. Click here for a detailed description of chart performance; click here for month-wise performance description.
Below are the Performance functionality screenshots:
In addition, you can perform the following actions for Performance module:
- Click
 to perform an advanced filter search. The below screen appears:
- Click the download icon and select a Format from the drop-down list as shown below.
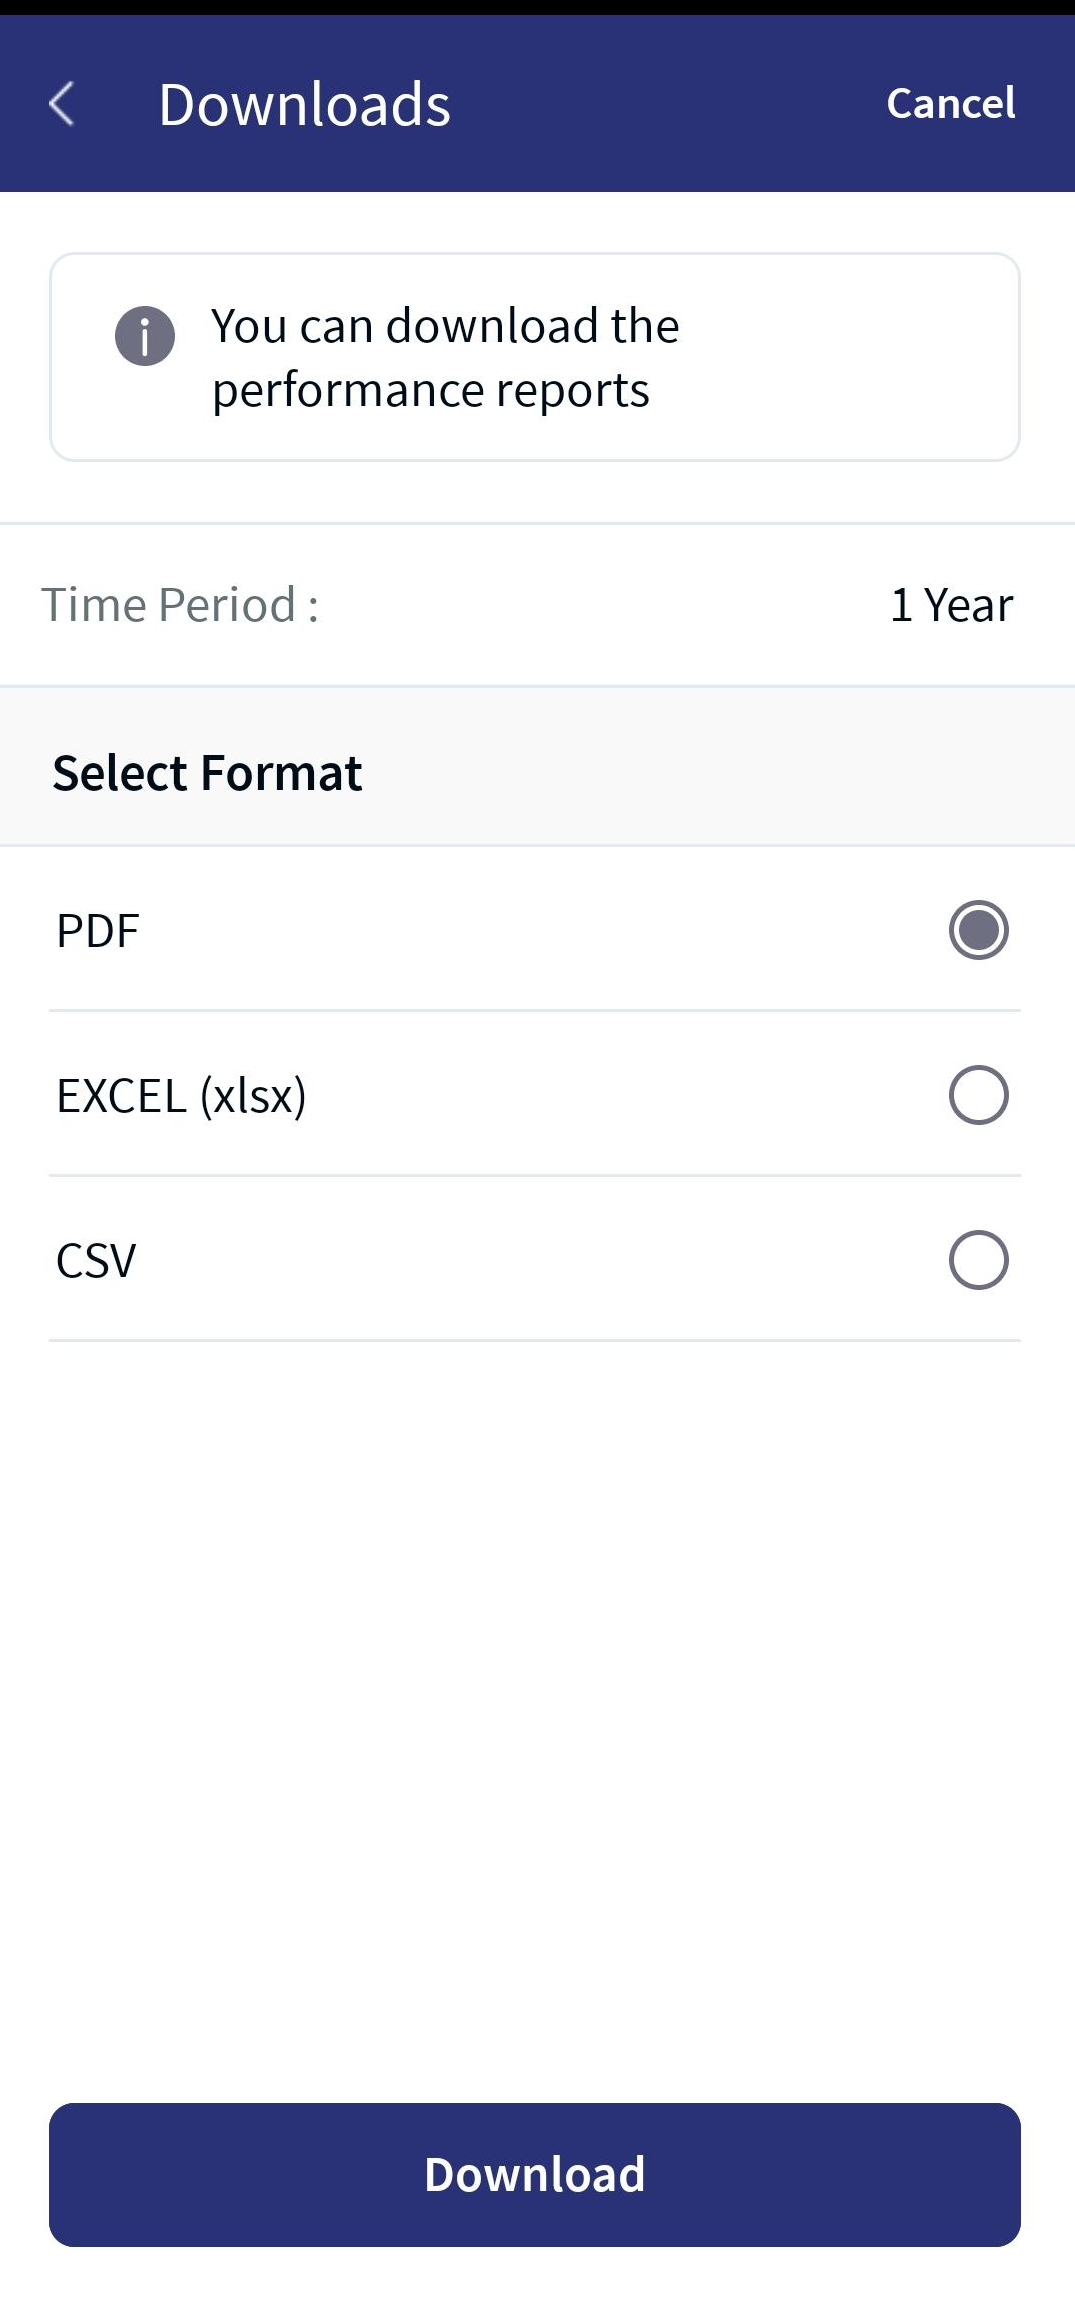
For a detailed description of the sort 'By Time Period' filter criteria and the Download functionalities, refer to the above Online Banking section.
In this topic