Dashboard
The Digital Wealth App provides a holistic view of your entire portfolio investment in the Dashboard Overview screen, where the features and actions are accessed based on the assigned permissions. The key metrics include total asset value, investment summary, asset allocation, recent transactions, and critical financial indicators, allowing you to monitor your financial health at a glance.
In addition, the Digital Wealth App has various other features:
- Access to Other Features (Retail, Payments, and Wealth) in the Hamburger menu: For Online Banking, click on the hamburger menu at the top-left corner of the screen and view the available features, whereas for the Mobile Native App, you need to click on the menu icon at the bottom-right corner of the screen. On clicking, you can view the user profile details, such as the User Name, Profile Pic, User Entity Last Login Details, and all the other features of the Retail, Payments, and Wealth App. For a detailed information about the features in the hamburger menu, click here.
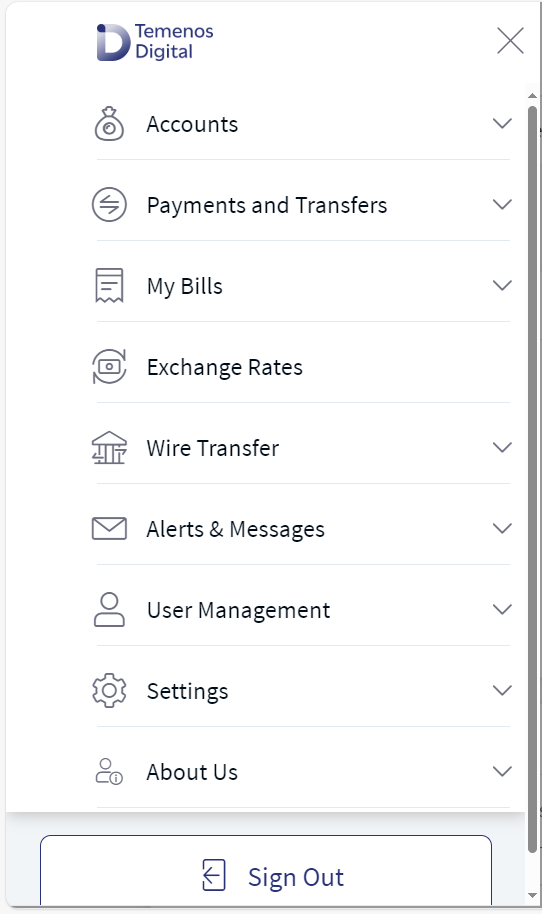
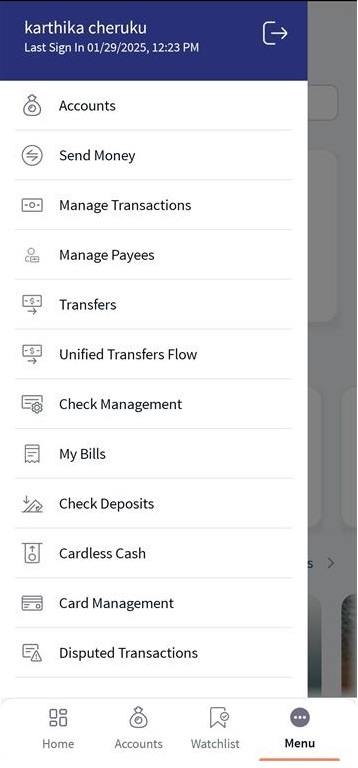
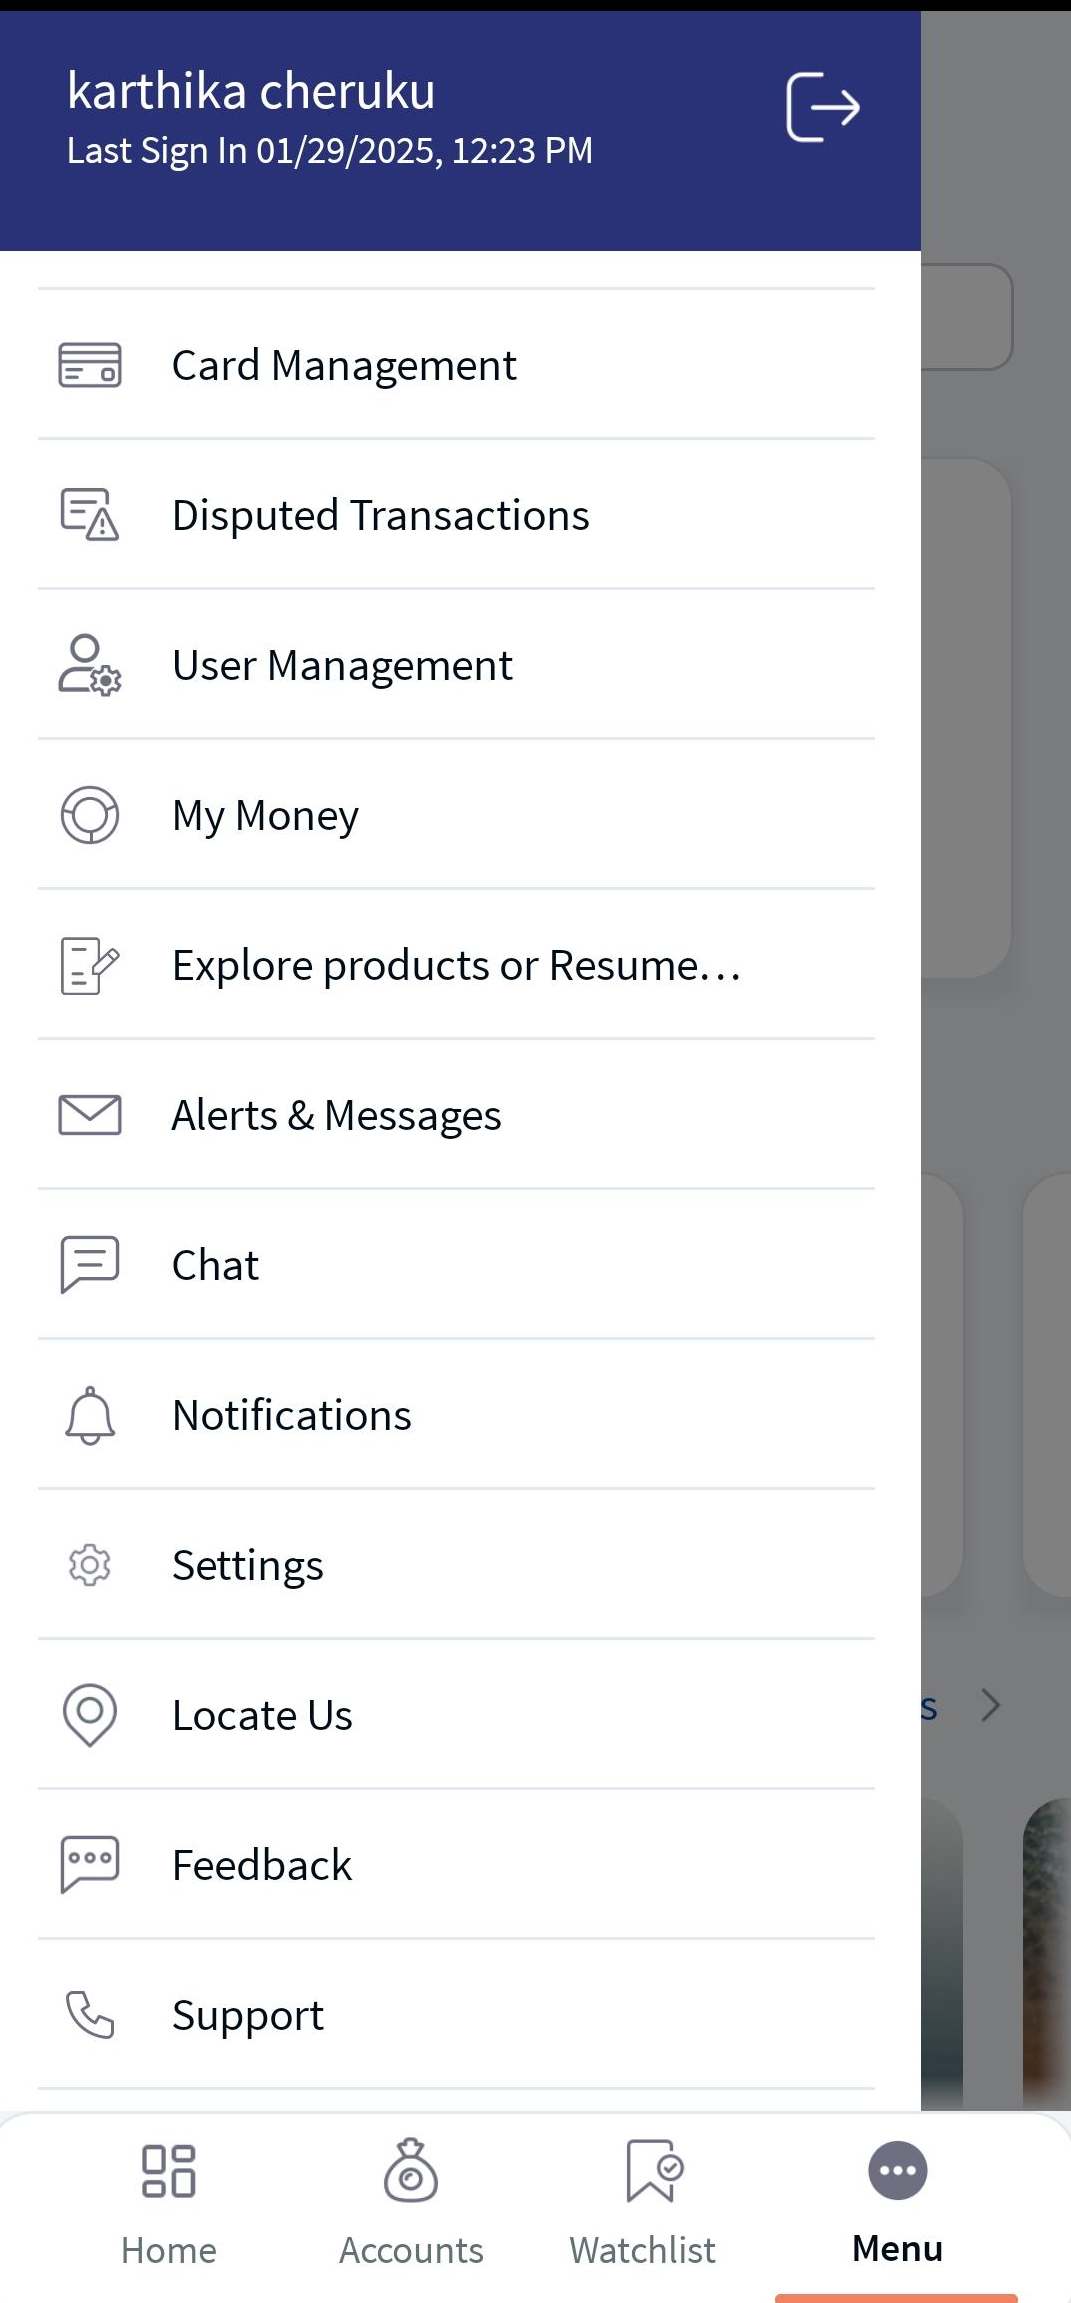
- Alerts and Messages:Facilitates setting up reminders, receiving communication from others, or other timely information on the Digital Wealth app. You can click the messages icon to view the notifications and respond to them accordingly, whereas, for the Mobile Native App, this feature is available in the menu icon.
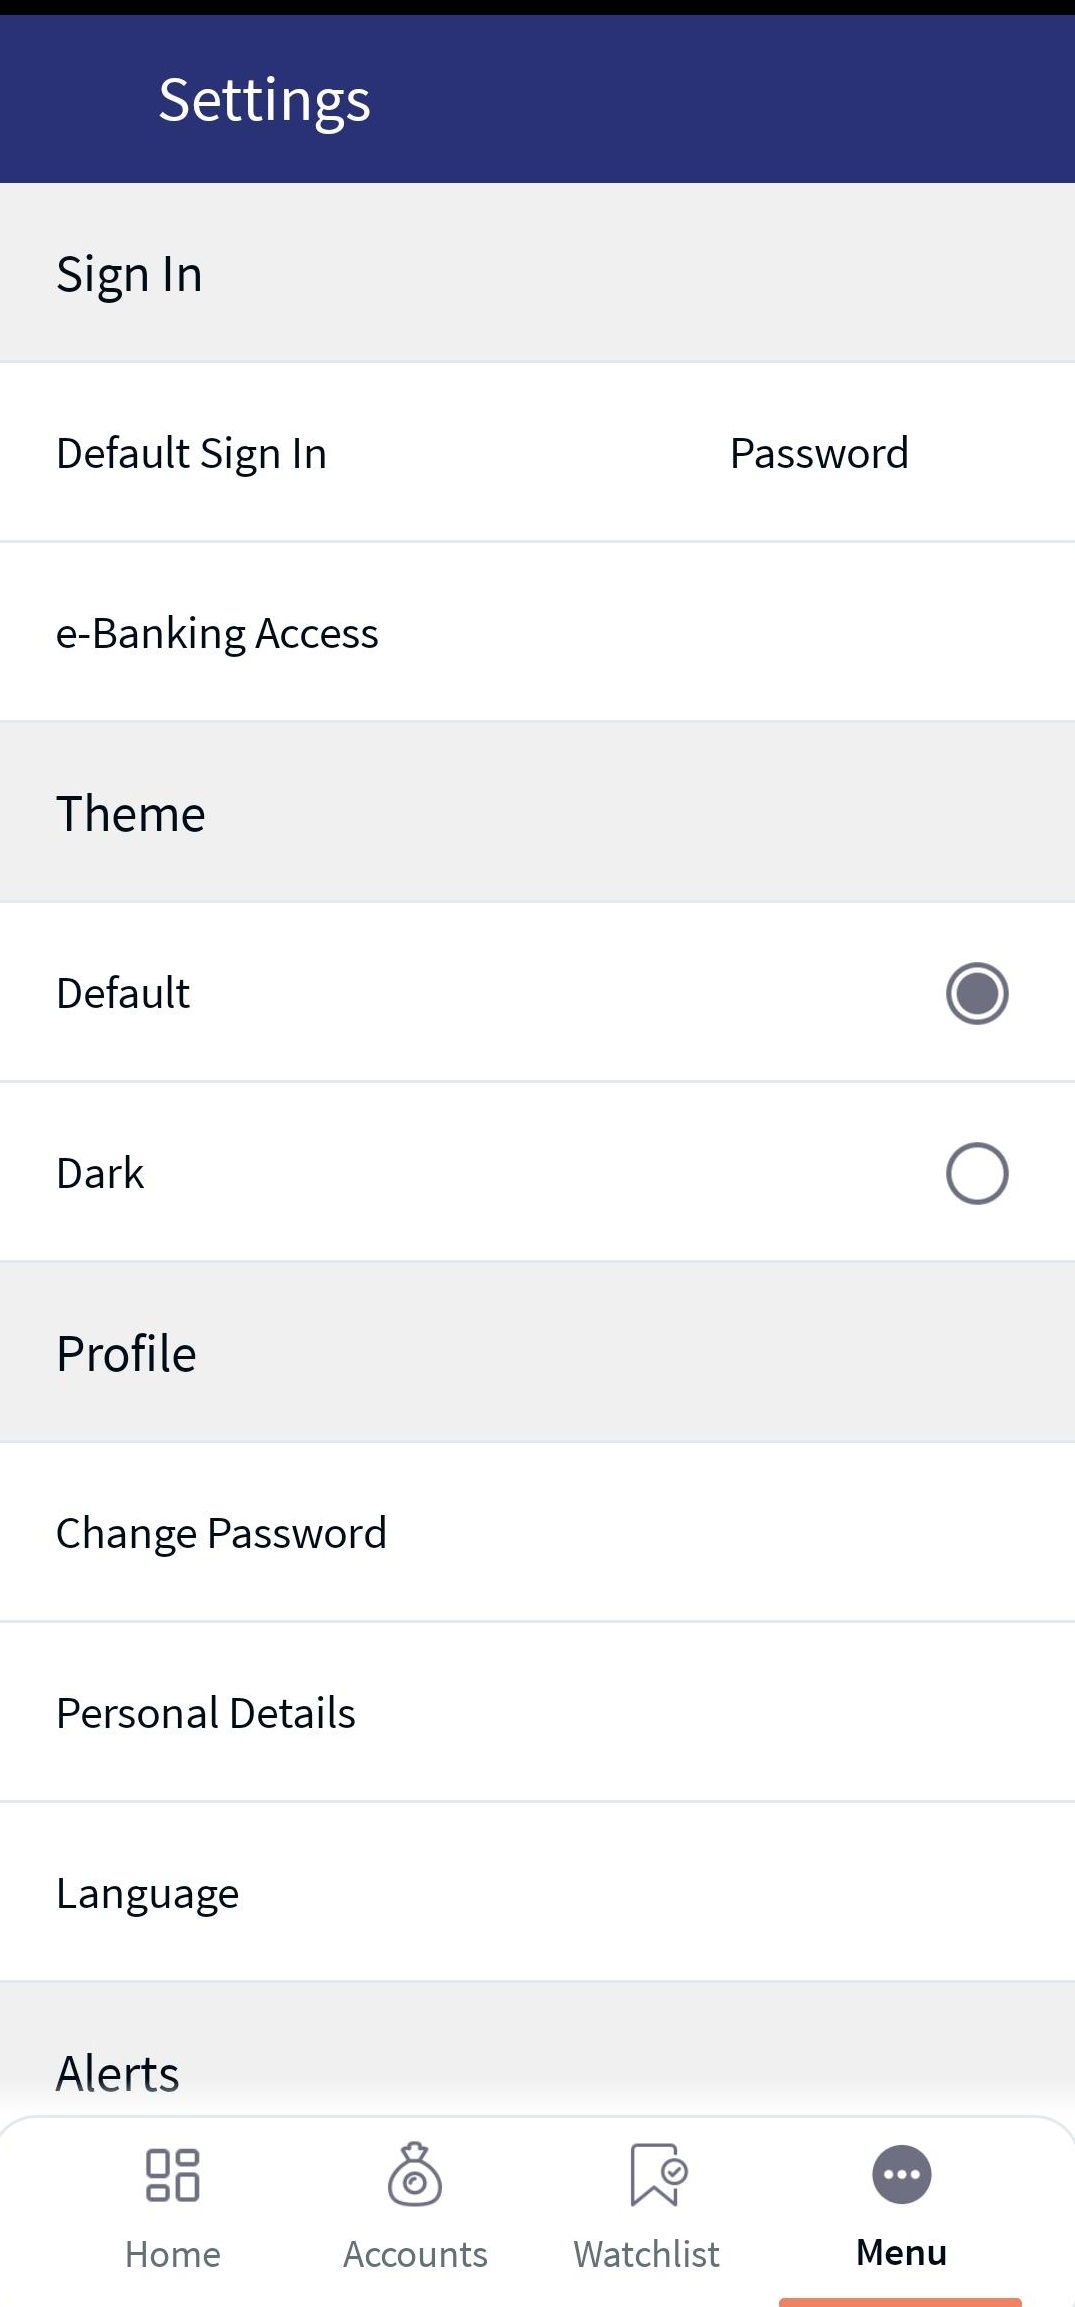
- Settings: You can view your profile, which is present at the upper-right corner of the page. Additionally, you can manage and configure various settings based on your needs. For the Mobile Native App, go to the menu icon and click the Settings option.
- Logout : Allows you to log out from the Wealth App, whereas, for the Mobile Native App, you need to click the
 icon at the top-right corner of the screen.
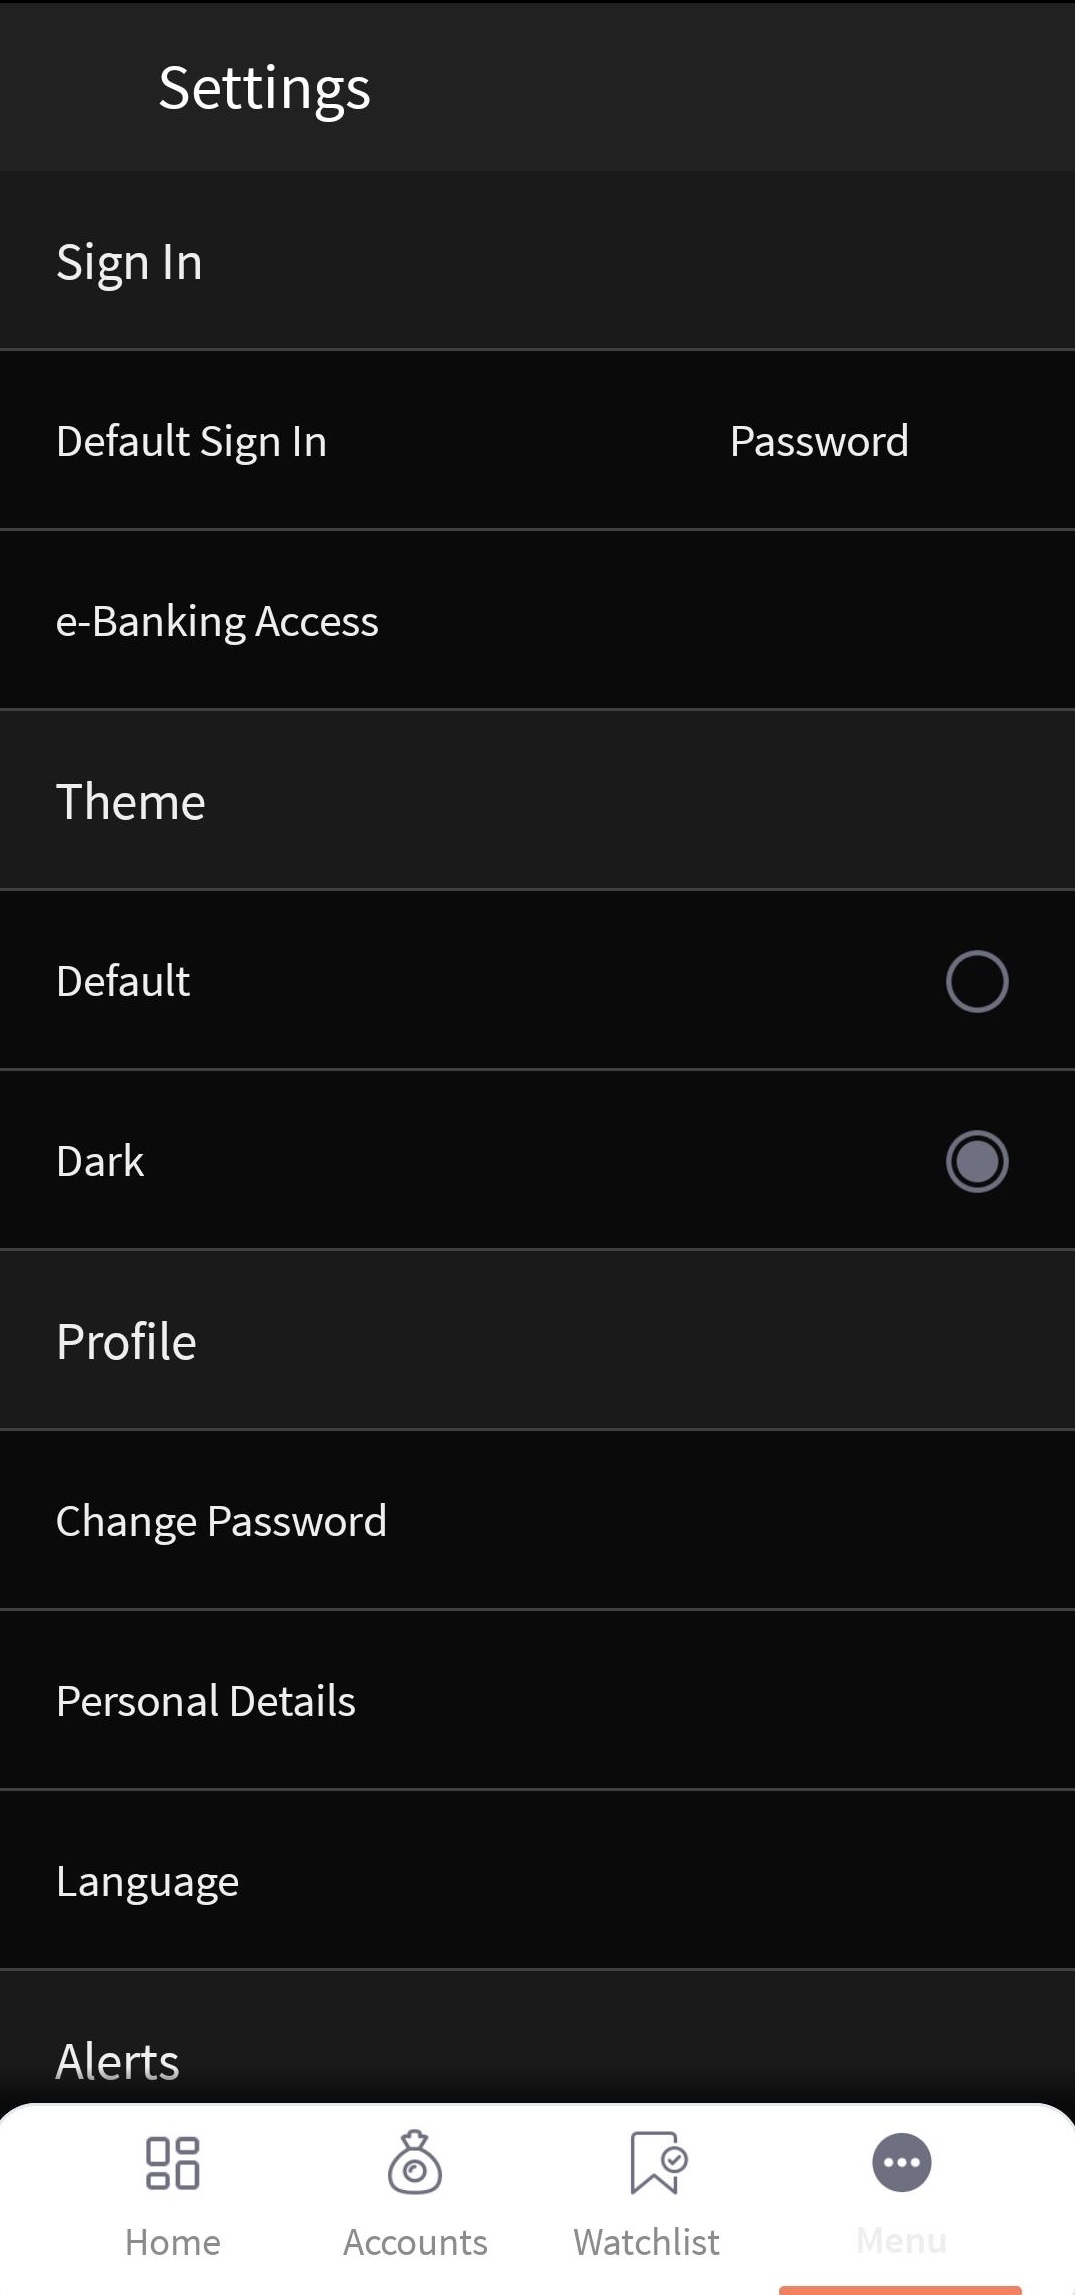
The mobile screens are available in light and dark themes. Based on your preferences, you can select a Theme. The system auto-enables the radio button as ‘Default,’ so you can view the screens in a light Theme. To change the Theme, click the Menu and then go to Settings. Under the Theme, enable the radio button to Dark. Below are the sample screens of the light and dark themes.
White Theme
Dark Theme
In addition, you can view the Digital Wealth app in light and dark themes. Below are the sample screens of the Home icon in light and dark themes.
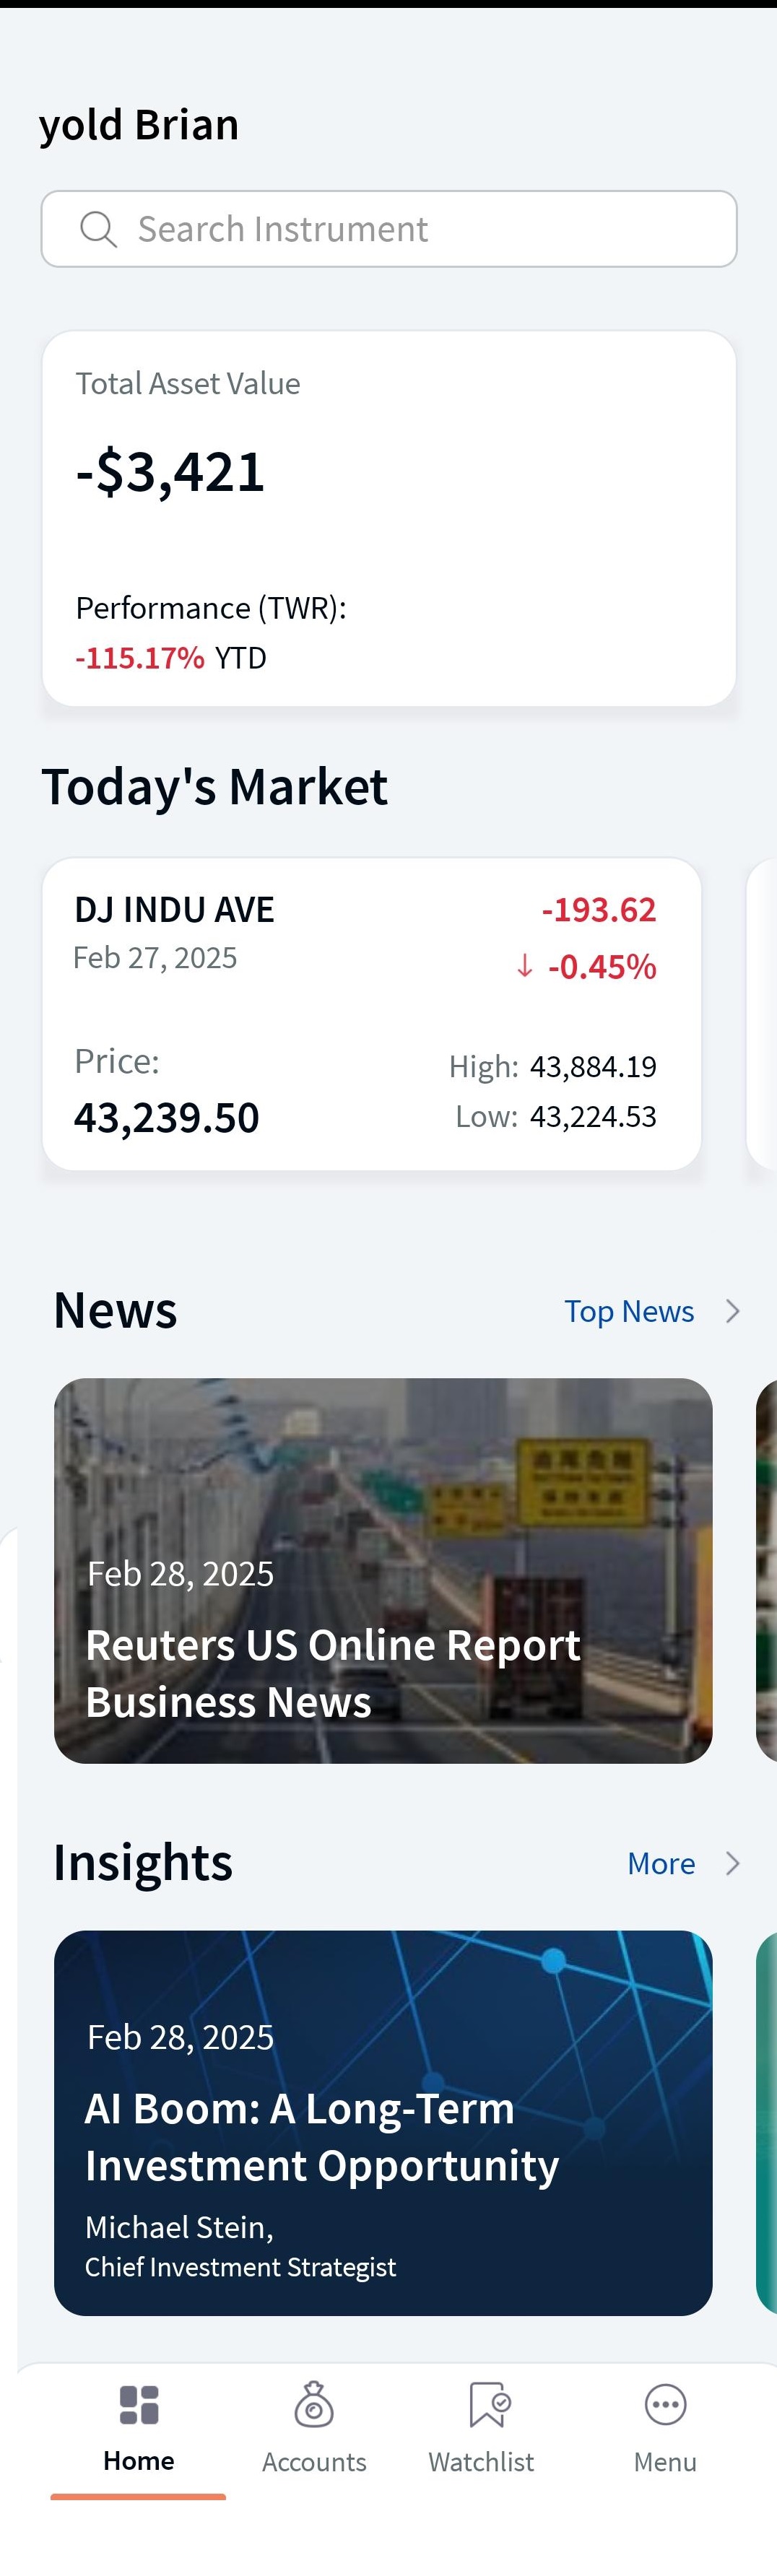
Home - White Theme
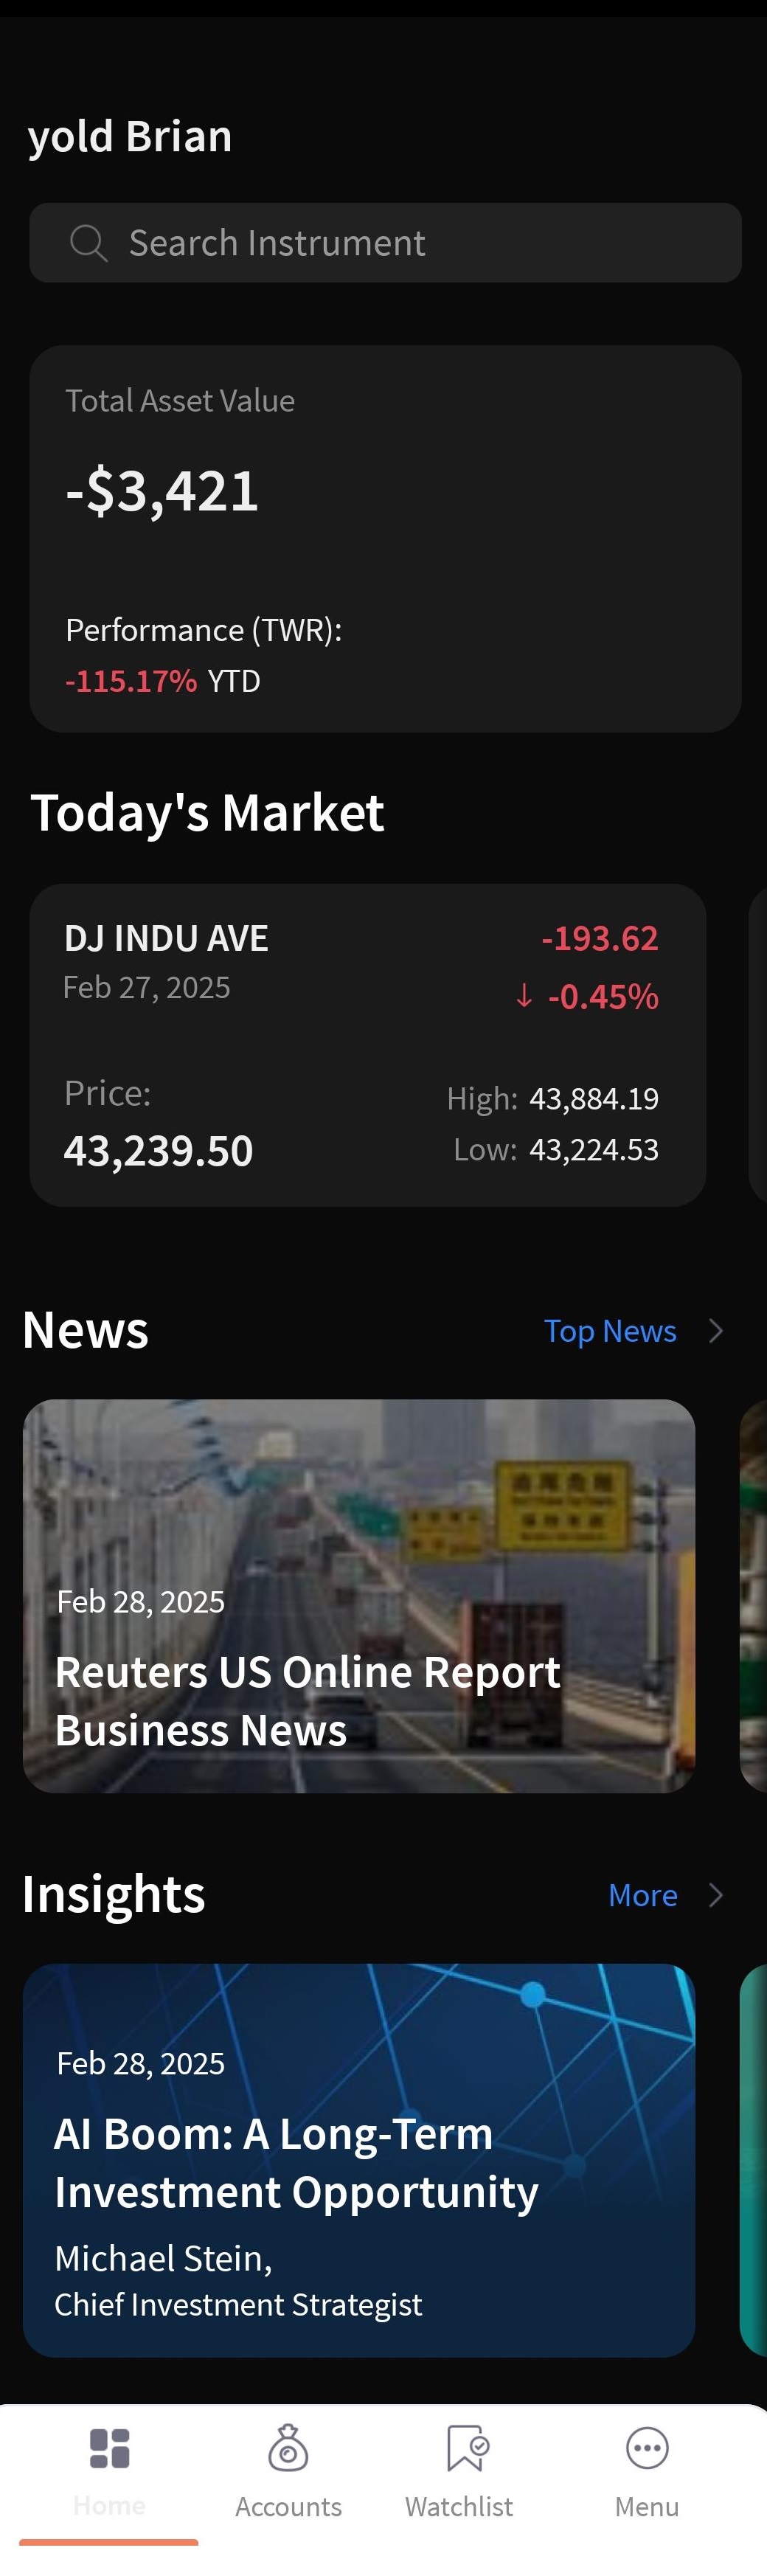
Home - Dark Theme
UX Overview - Accounts Dashboard and Home
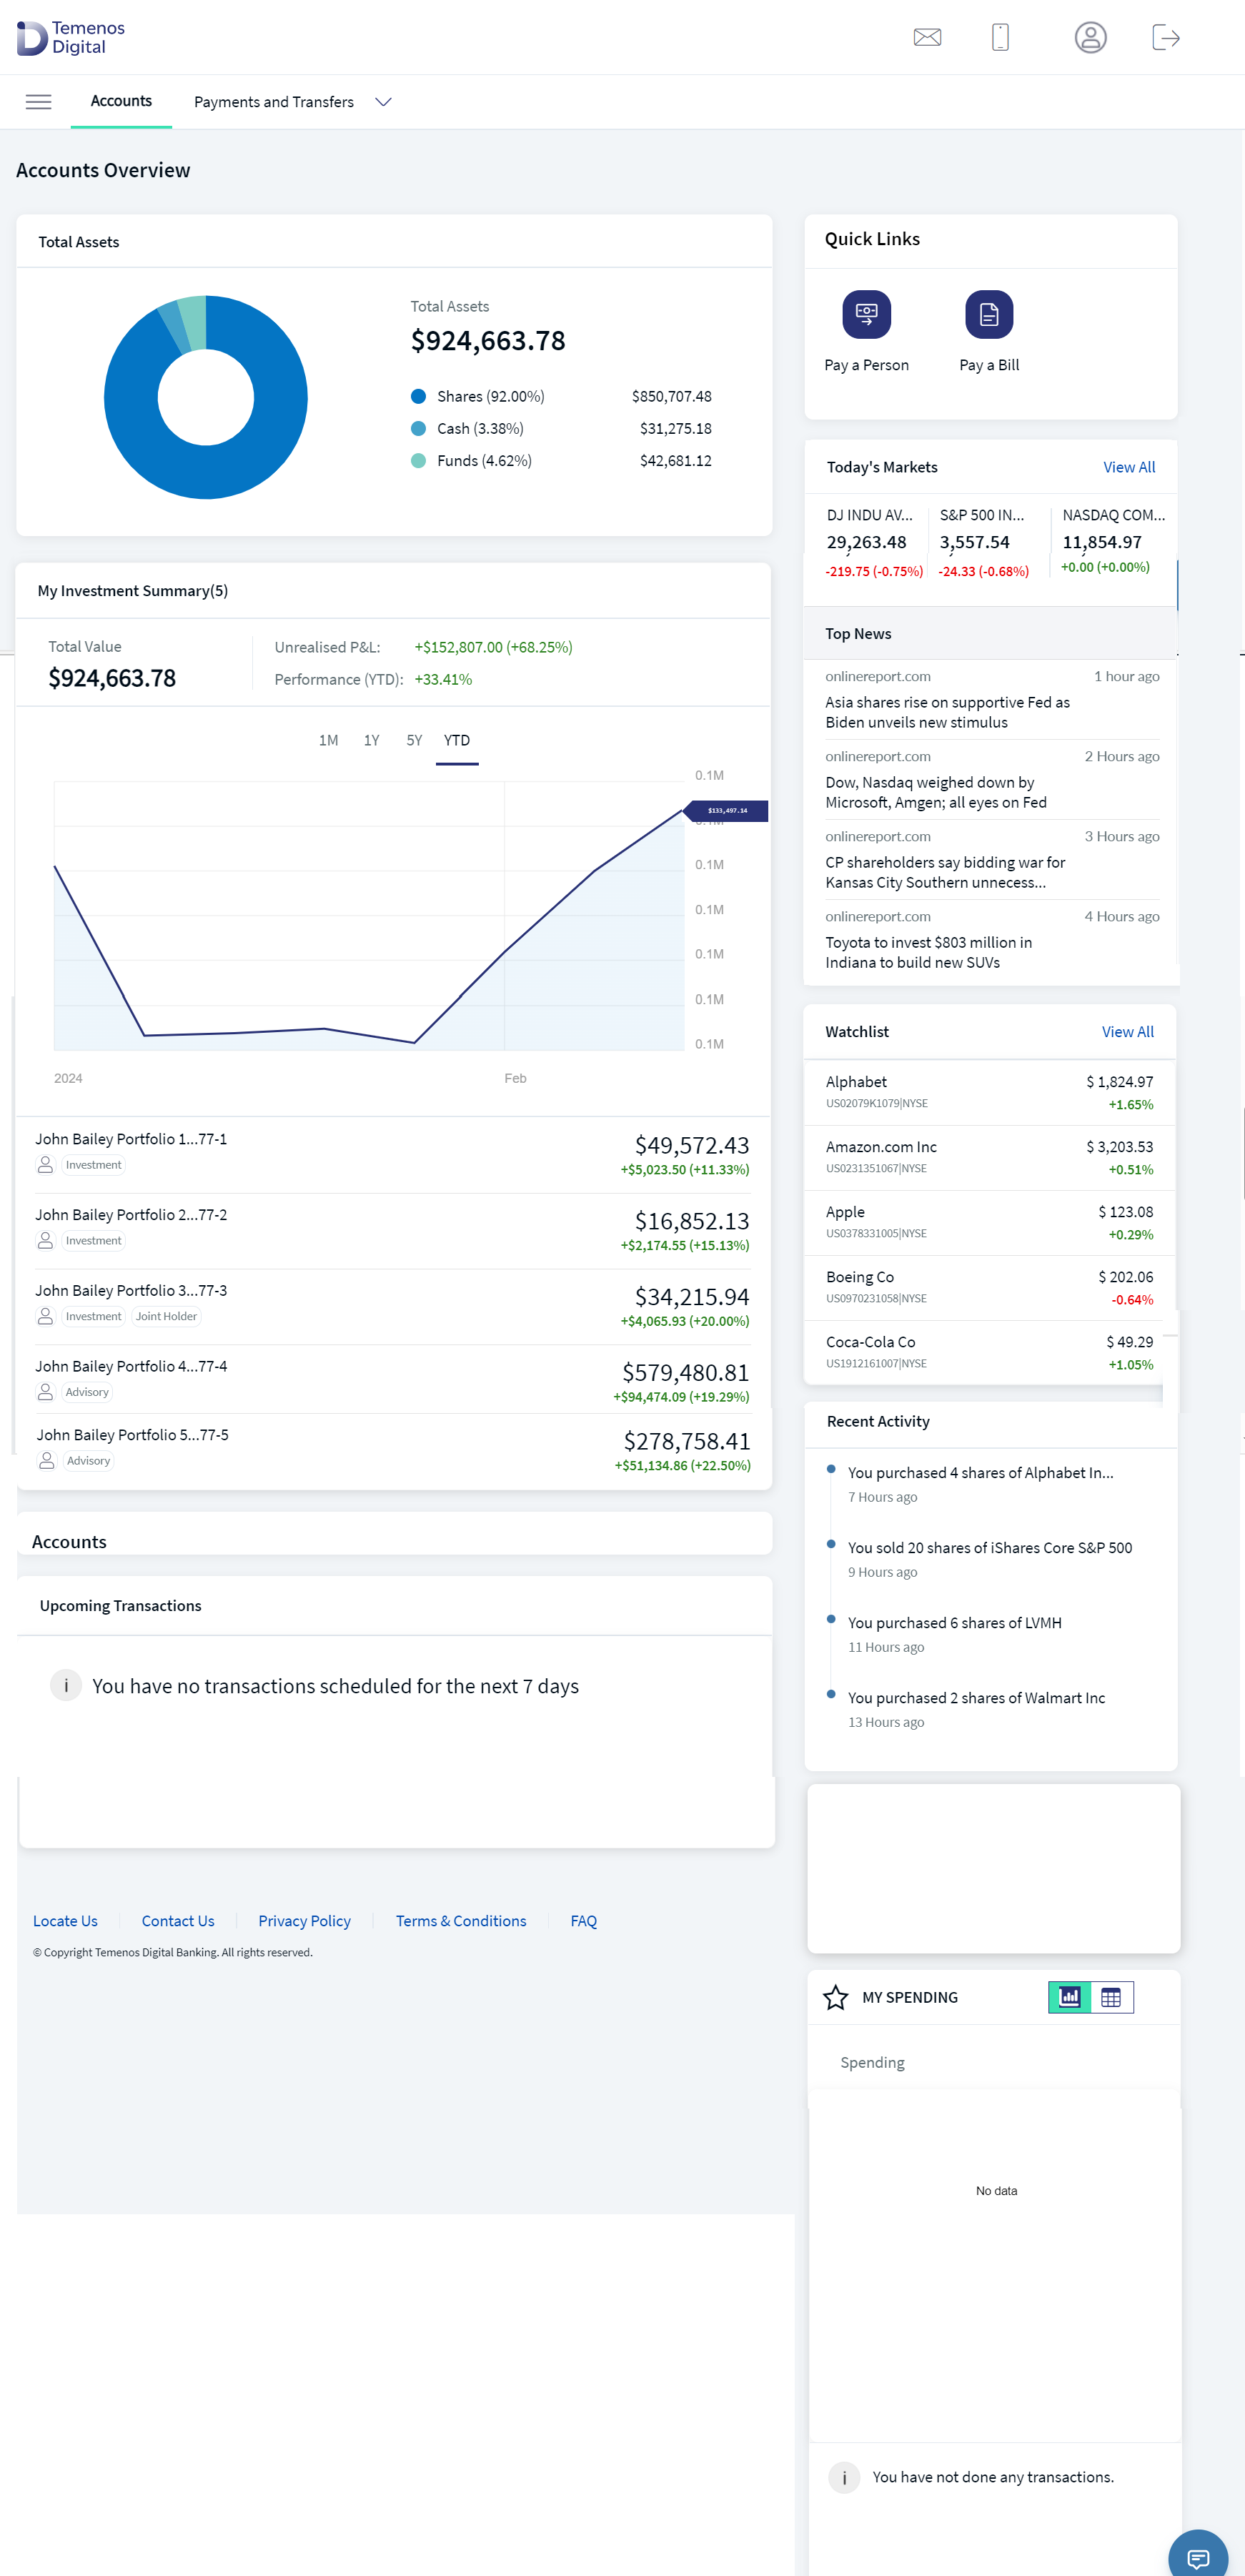
Online Banking - Accounts Dashboard:Upon login, the Wealth Dashboard offers a 360-degree view of your investment details i.e., the investment summary and the details of the other bank accounts. It provides My Assets view, where the investments across the asset classes are displayed as a pie chart. The account details, including individual and consolidated investment accounts, are available with a separate option to view the Savings and Checking account details. The Accounts Dashboard also contains Today’s Market news section, where the different global indices can be configured.
The user interface of the Accounts Dashboard module is categorized into the following features:
- Total Assets
- My Investment Summary
- Accounts
- Upcoming Transactions
- Quick Links
- Today's Market
- Top News
- Watchlist
- Recent Activity
- My Spending
Go to the Feature Description section to gain a high-level understanding of each Dashboard feature.
Mobile Native App - Home:The mobile native app user interface aims to increase the efficiency of the client experience with personalized banking using a global network and to gain a competitive edge in the Wealth market. It facilitates you in managing your Wealth Portfolio through regular checks at ease.
In mobile, after you enter your credentials in the Digital Wealth app, the Home is the login/dashboard screen
The Home screen of the mobile native app has the following features:
- Customer Name: Displays the Customer Name, which is present at the top left corner of the screen.
- Search Instrument :Facilitates you in searching for a specific instrument. This feature allows you to search for a specific instrument, view the details, and place an order. For more details on Place an Order feature, click here.
- Total Asset Value: This feature displays your portfolio's total asset value and the performance percentage value. Profit is displayed in Green, and the loss is displayed in Red. When you click the widget, the system navigates you to the Investment Summary feature of the Accounts tab.
- Investment Summary: Displays a consolidated overview of your investments and portfolios, including the Total Asset Value and Performance Metrics. For a detailed description, click here.
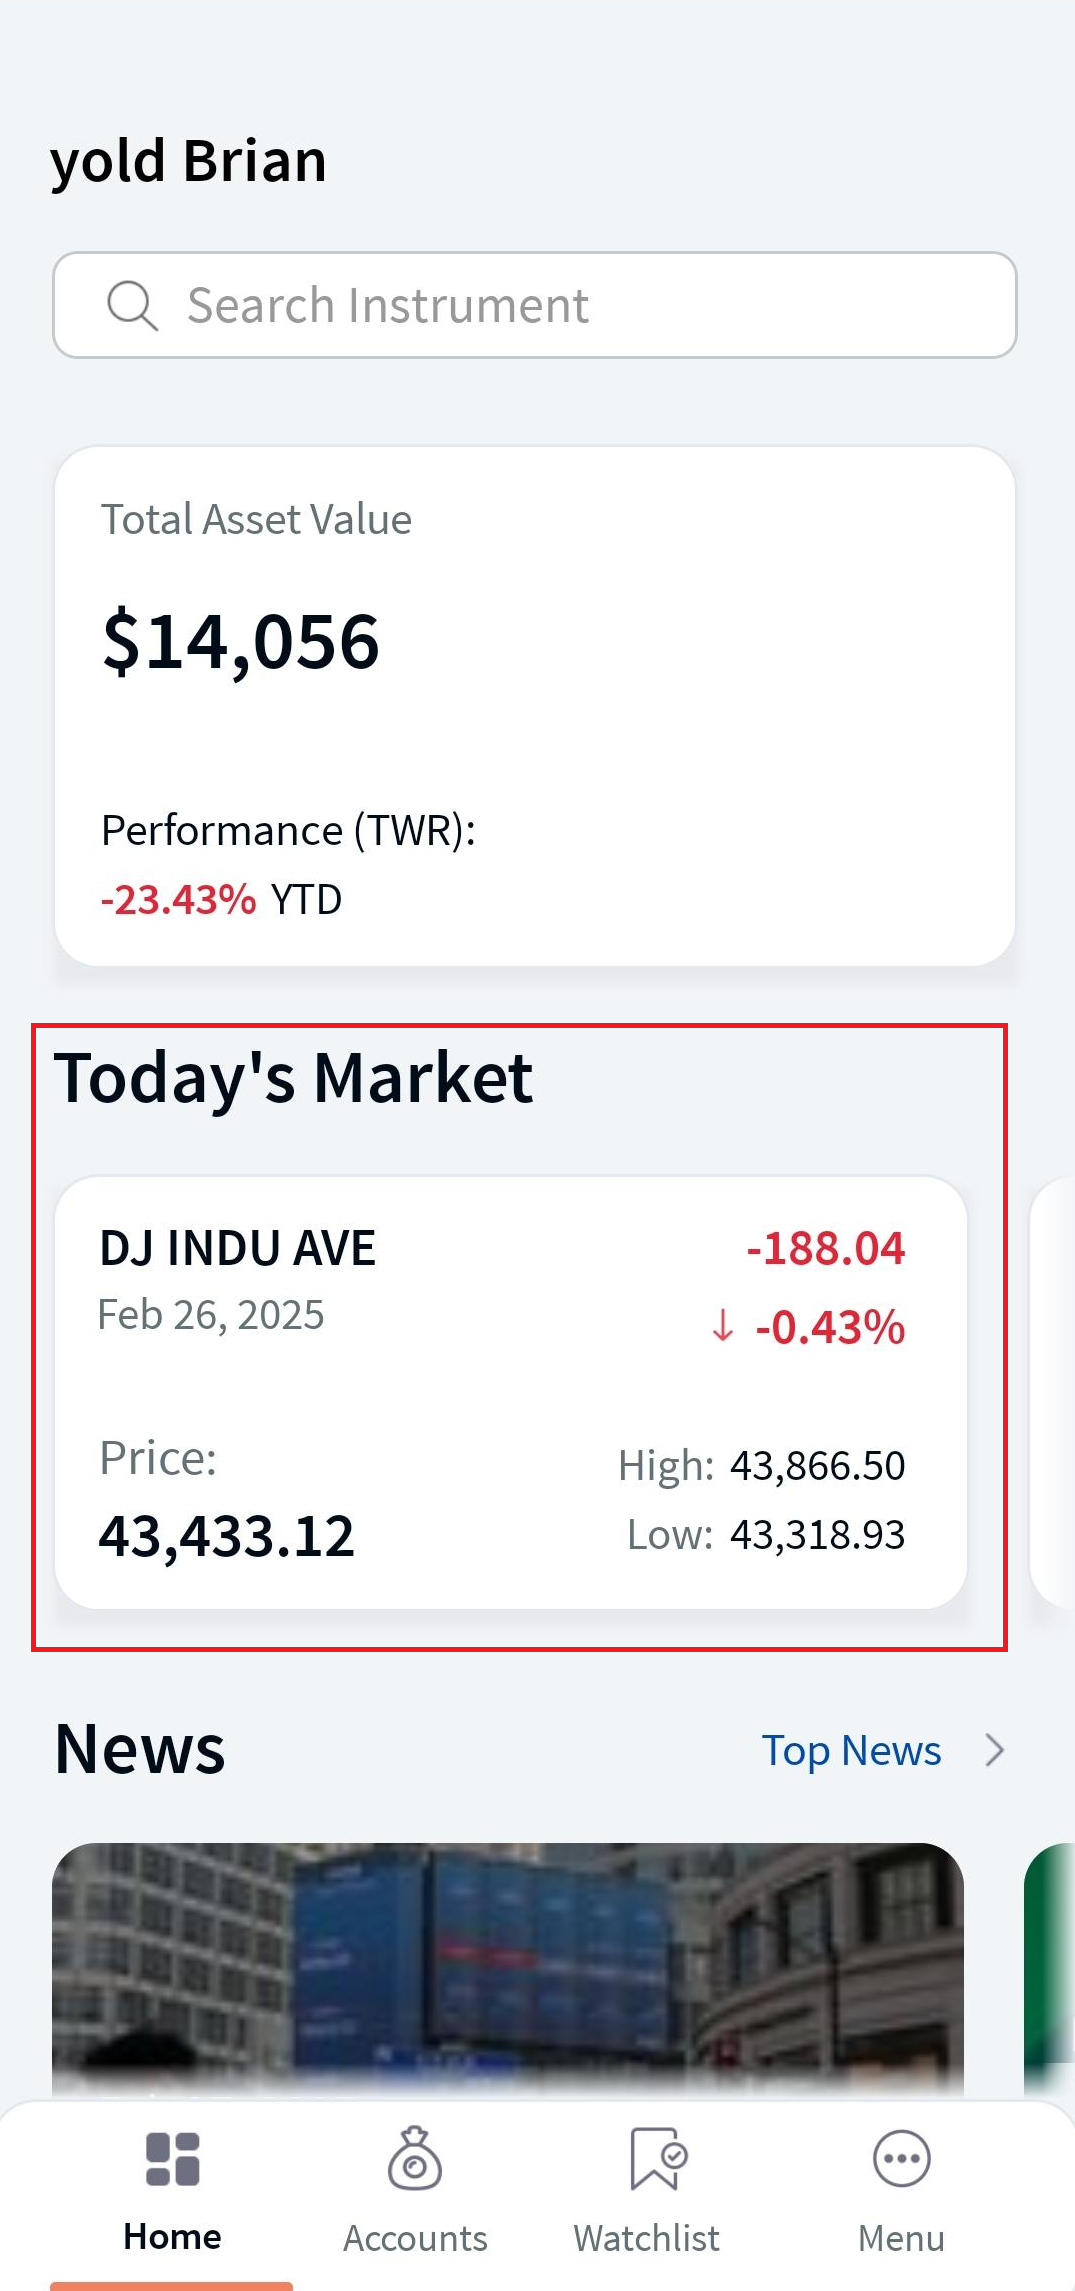
- Today's Market: Displays the market movements, global indices along with the index (Price) value, the gain or loss for the day, and the percentage of gain or loss.
Based on the bank's configuration, the total number of cards is displayed to the user in a swipeable manner.
- News/ Top News: Displays the current market news and the news related to trading instruments such as stocks, bonds, commodities etc. It is swipeable from left to right. A “Top News” link is displayed if more than three articles are available. On clicking the link, detailed information about the article is displayed. For a detailed description and the relevant screens, click here.
- Insights: Facilitates viewing the latest research analysis and investment updates, guiding you in making informed investment decisions. The Insights articles are swipeable from left to right. The “More” link is displayed if more than three insights are available.
Insights are available as a mock service and are not part of the Transact and Wealth FO integration.
- Footer Menu: Displays the Home, Accounts, Watchlist, and Menu options at the bottom of the screen. On click, the system navigates you to the respective feature, where you can perform specific actions. Also, when you click on any of the footer menus, the selected icon gets highlighted with a secondary color with an outline.
- In addition, you can view a detailed description of the menu icon and the relevant screens in the Access to Other Features (Retail, Payments, and Wealth) section.
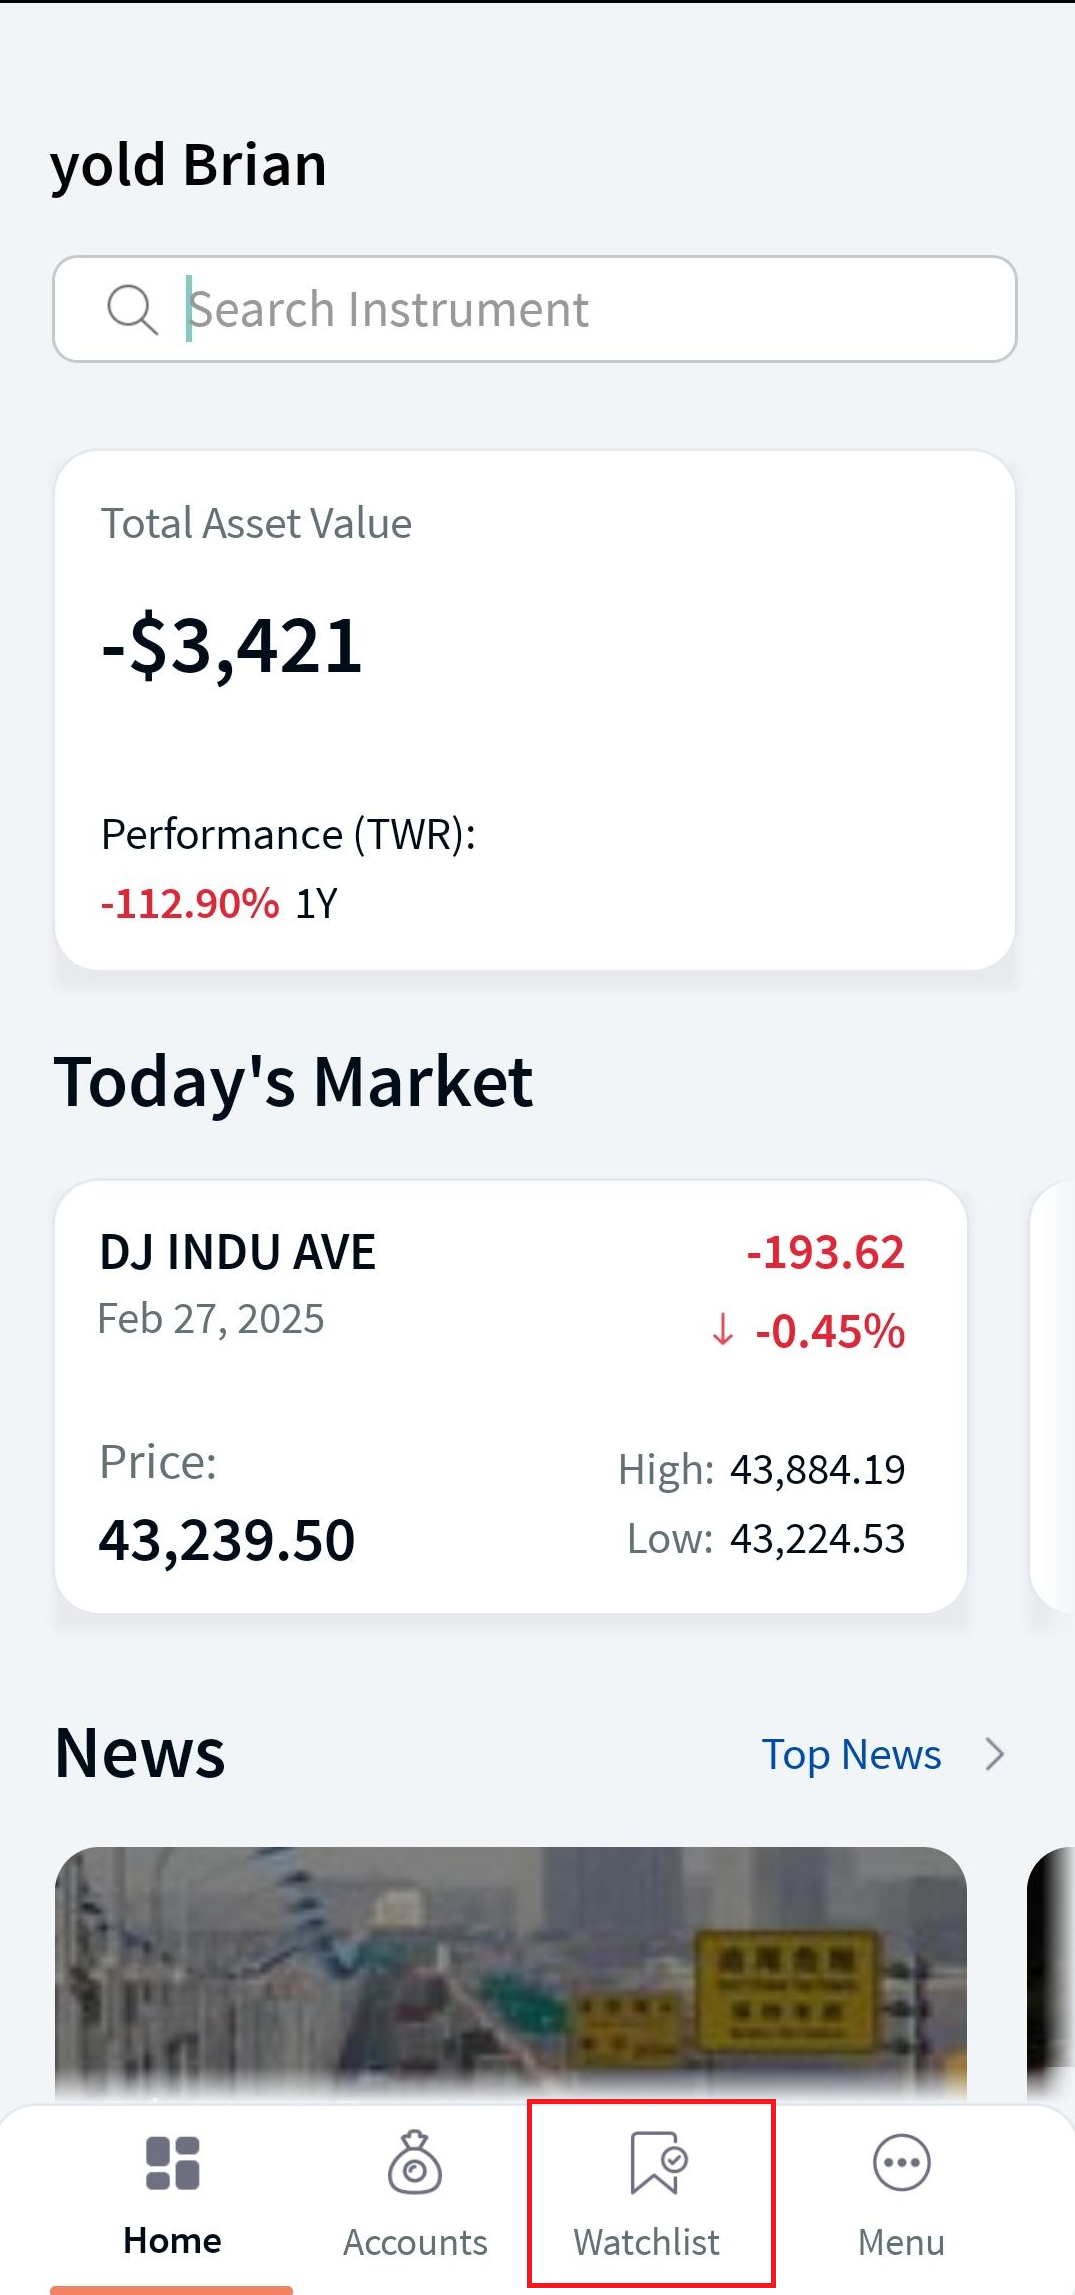
In Online Banking, the Watchlist feature appears as a widget in the Accounts Dashboard screen, at the bottom-right corner of the screen, whereas in mobile, a Watchlist icon is present at the footer menu and is displayed only to the users. For a detailed description of the watchlist, click here.
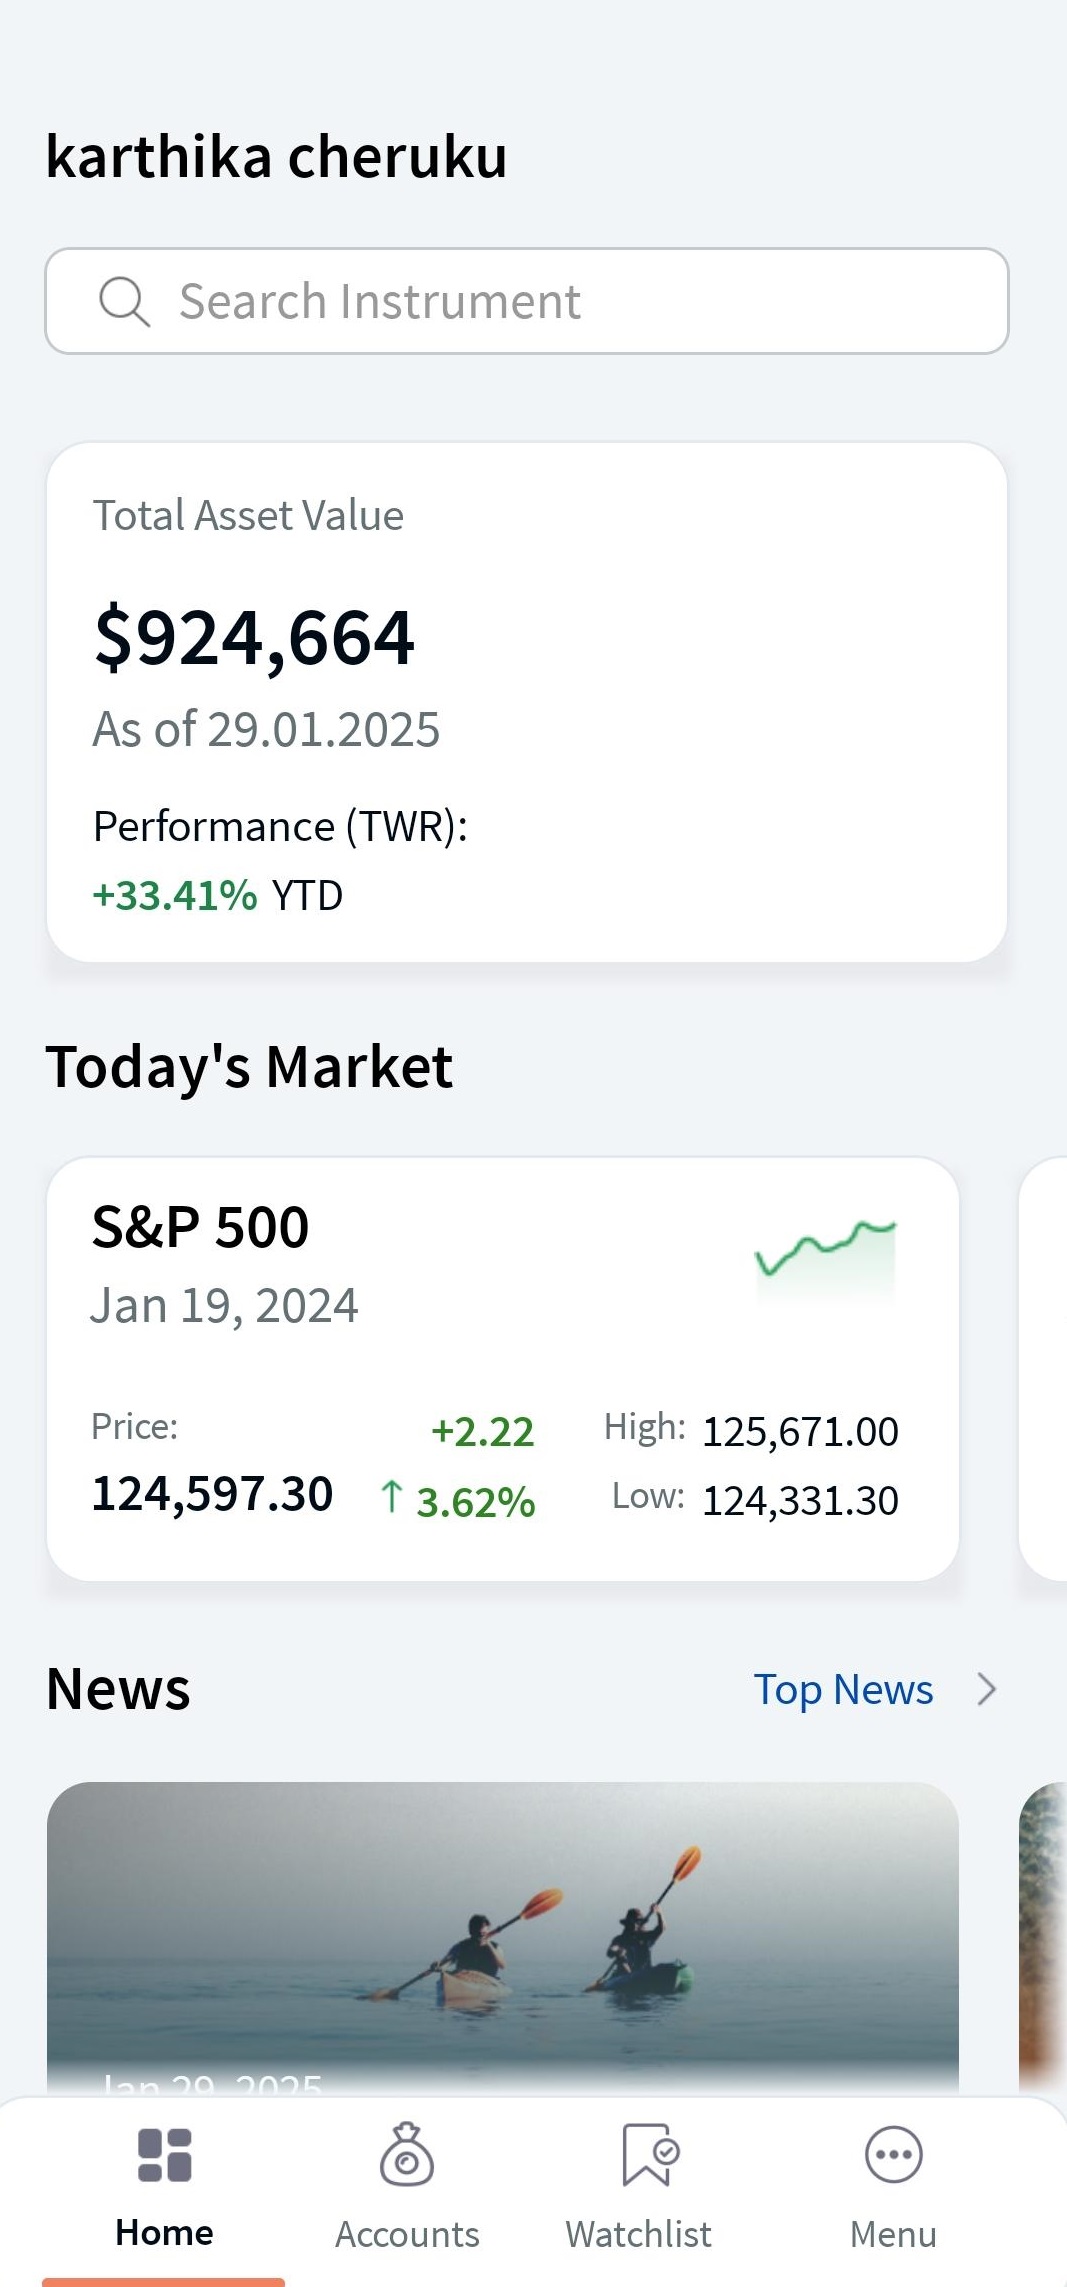
Home - Screen 1
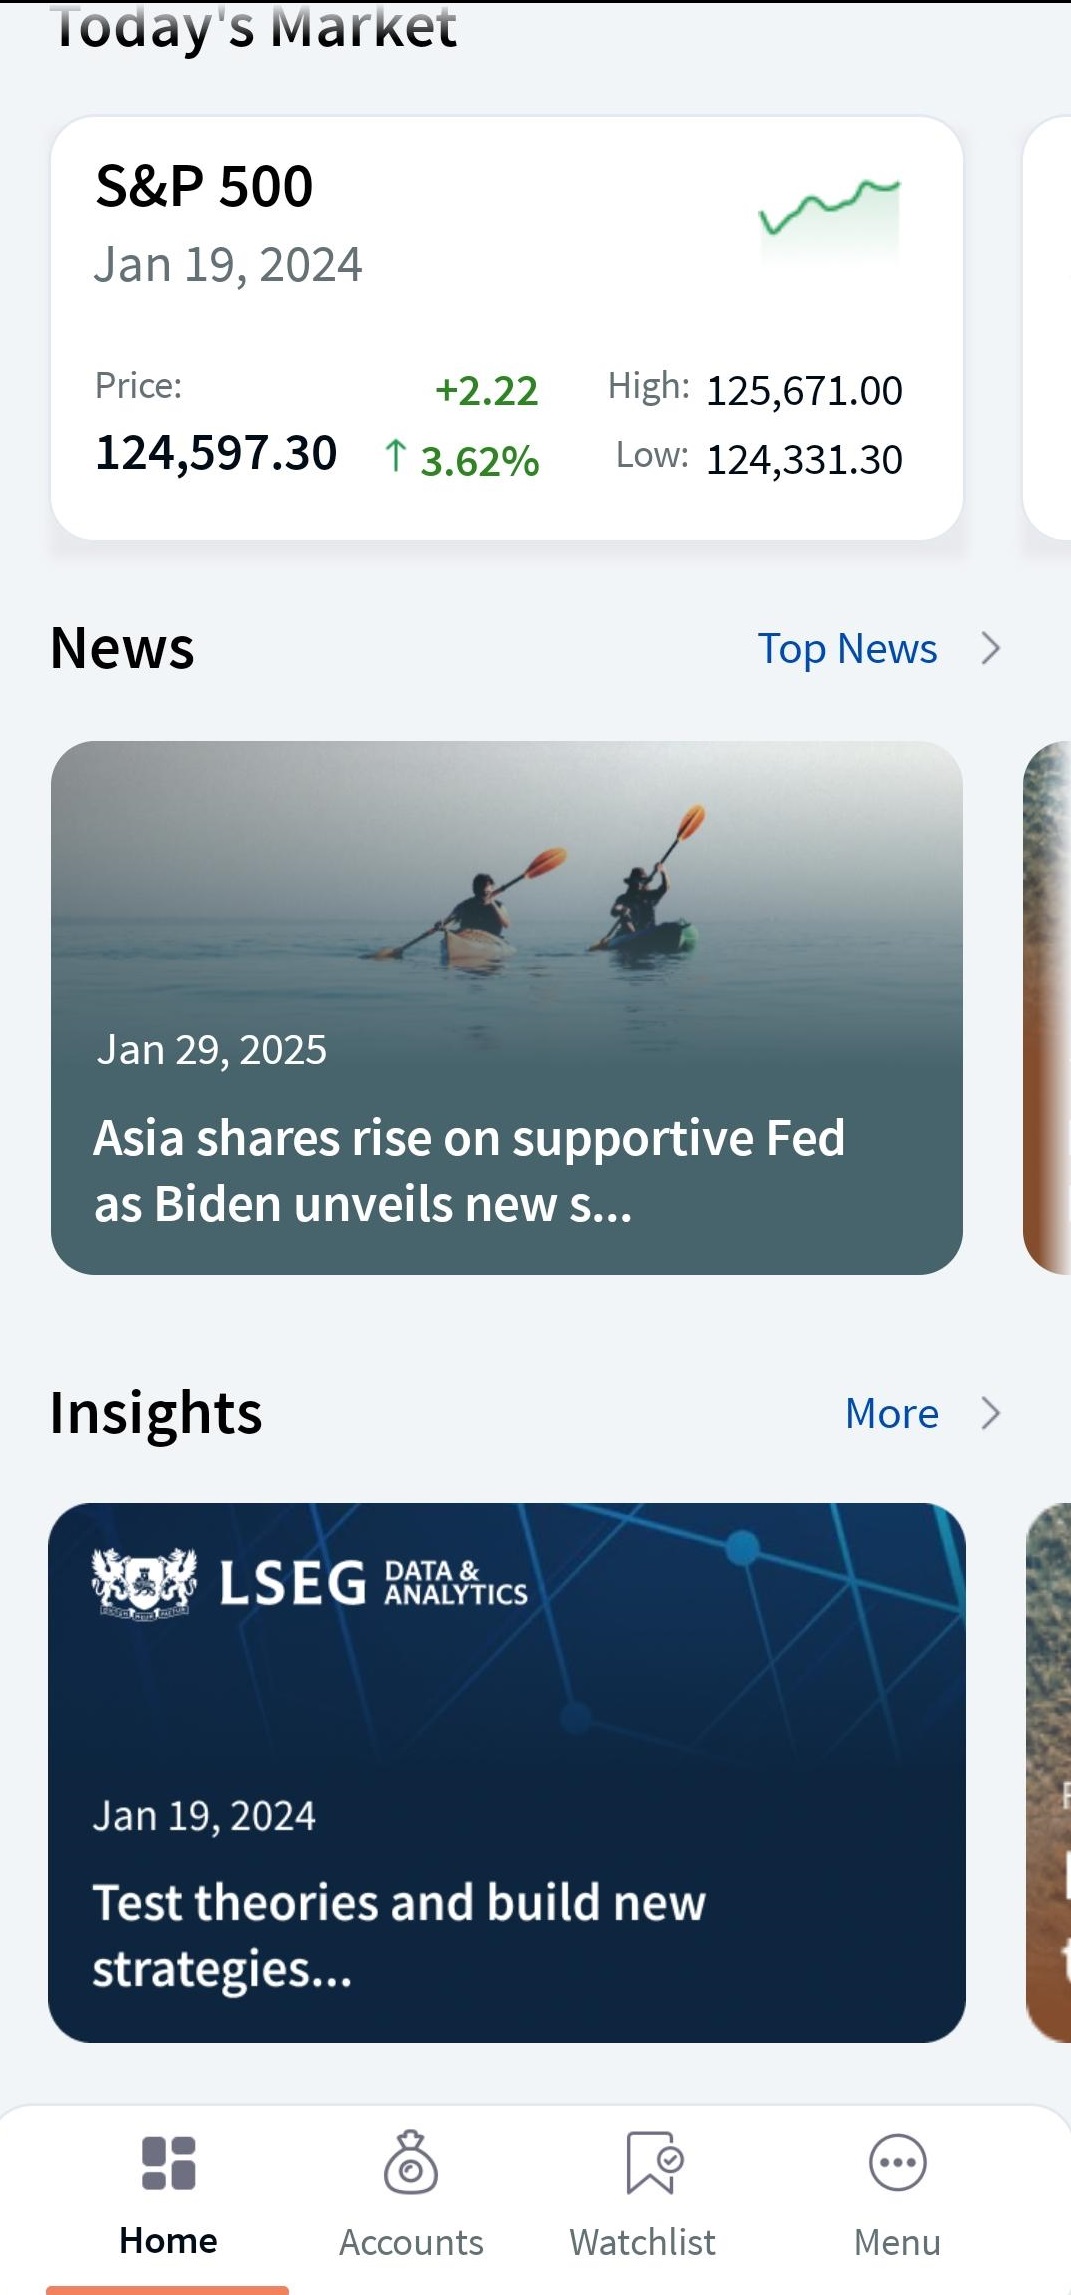
Home - Screen 2
Each icon at the footer menu, i.e., Home, Accounts, Watchlist, and Menu is categorized into various features:
- Home - To know the features available in the Home, and their respective descriptions, click here.
- Accounts - My Investment Summary, Recent Activity, Investment Accounts, Savings Accounts, Checking Accounts, Credit Cards, Loan Accounts, and Total Asset Allocation features are available in the Accounts icon. For more information on each feature, refer to the mobile native app section of the respective feature.
- Watchlist - For a detailed description of the watchlist, click here.
- Menu - For a detailed description of the menu icon and the relevant screens, click here.
The table below provides an overview of the features, the component information, and the configurable elements.
| Section | Component | Configurable Elements |
|---|---|---|
Total Assets: This section displays the total value of the assets along with a graphical representation of the asset categorization. This section is not available as part of the Transact Integration. | NA | |
My Investment Summary: This section displays a graphical representation of your investments along with a list of your investment accounts. | com.wealth.common.investmentLineChart | NA |
| Personal Accounts: This section displays a list of all your accounts. | NA | NA |
Today's Markets: This section displays details about the current market. The data for the Today's Markets section is retrieved from the Market Data Provider. | com.konyolb.wealth.marketIndexDashComp | NA |
Top News: This section displays the latest stock news. The data for the Top News section is retrieved from the Market Data Provider. | com.konyolb.wealth.marketNewsCardComp | NA |
Watchlist: This section displays the instrument details or the asset added to your watchlist. You can also set an alert price to the instrument in the watchlist.
| com.olb.wealth.WatchlistDashCard | NA |
| Recent Activity: This section displays the recent activities of your portfolios. | com.olb.wealth.recentActivityComp | NA |
Sequence Diagram -Dashboard
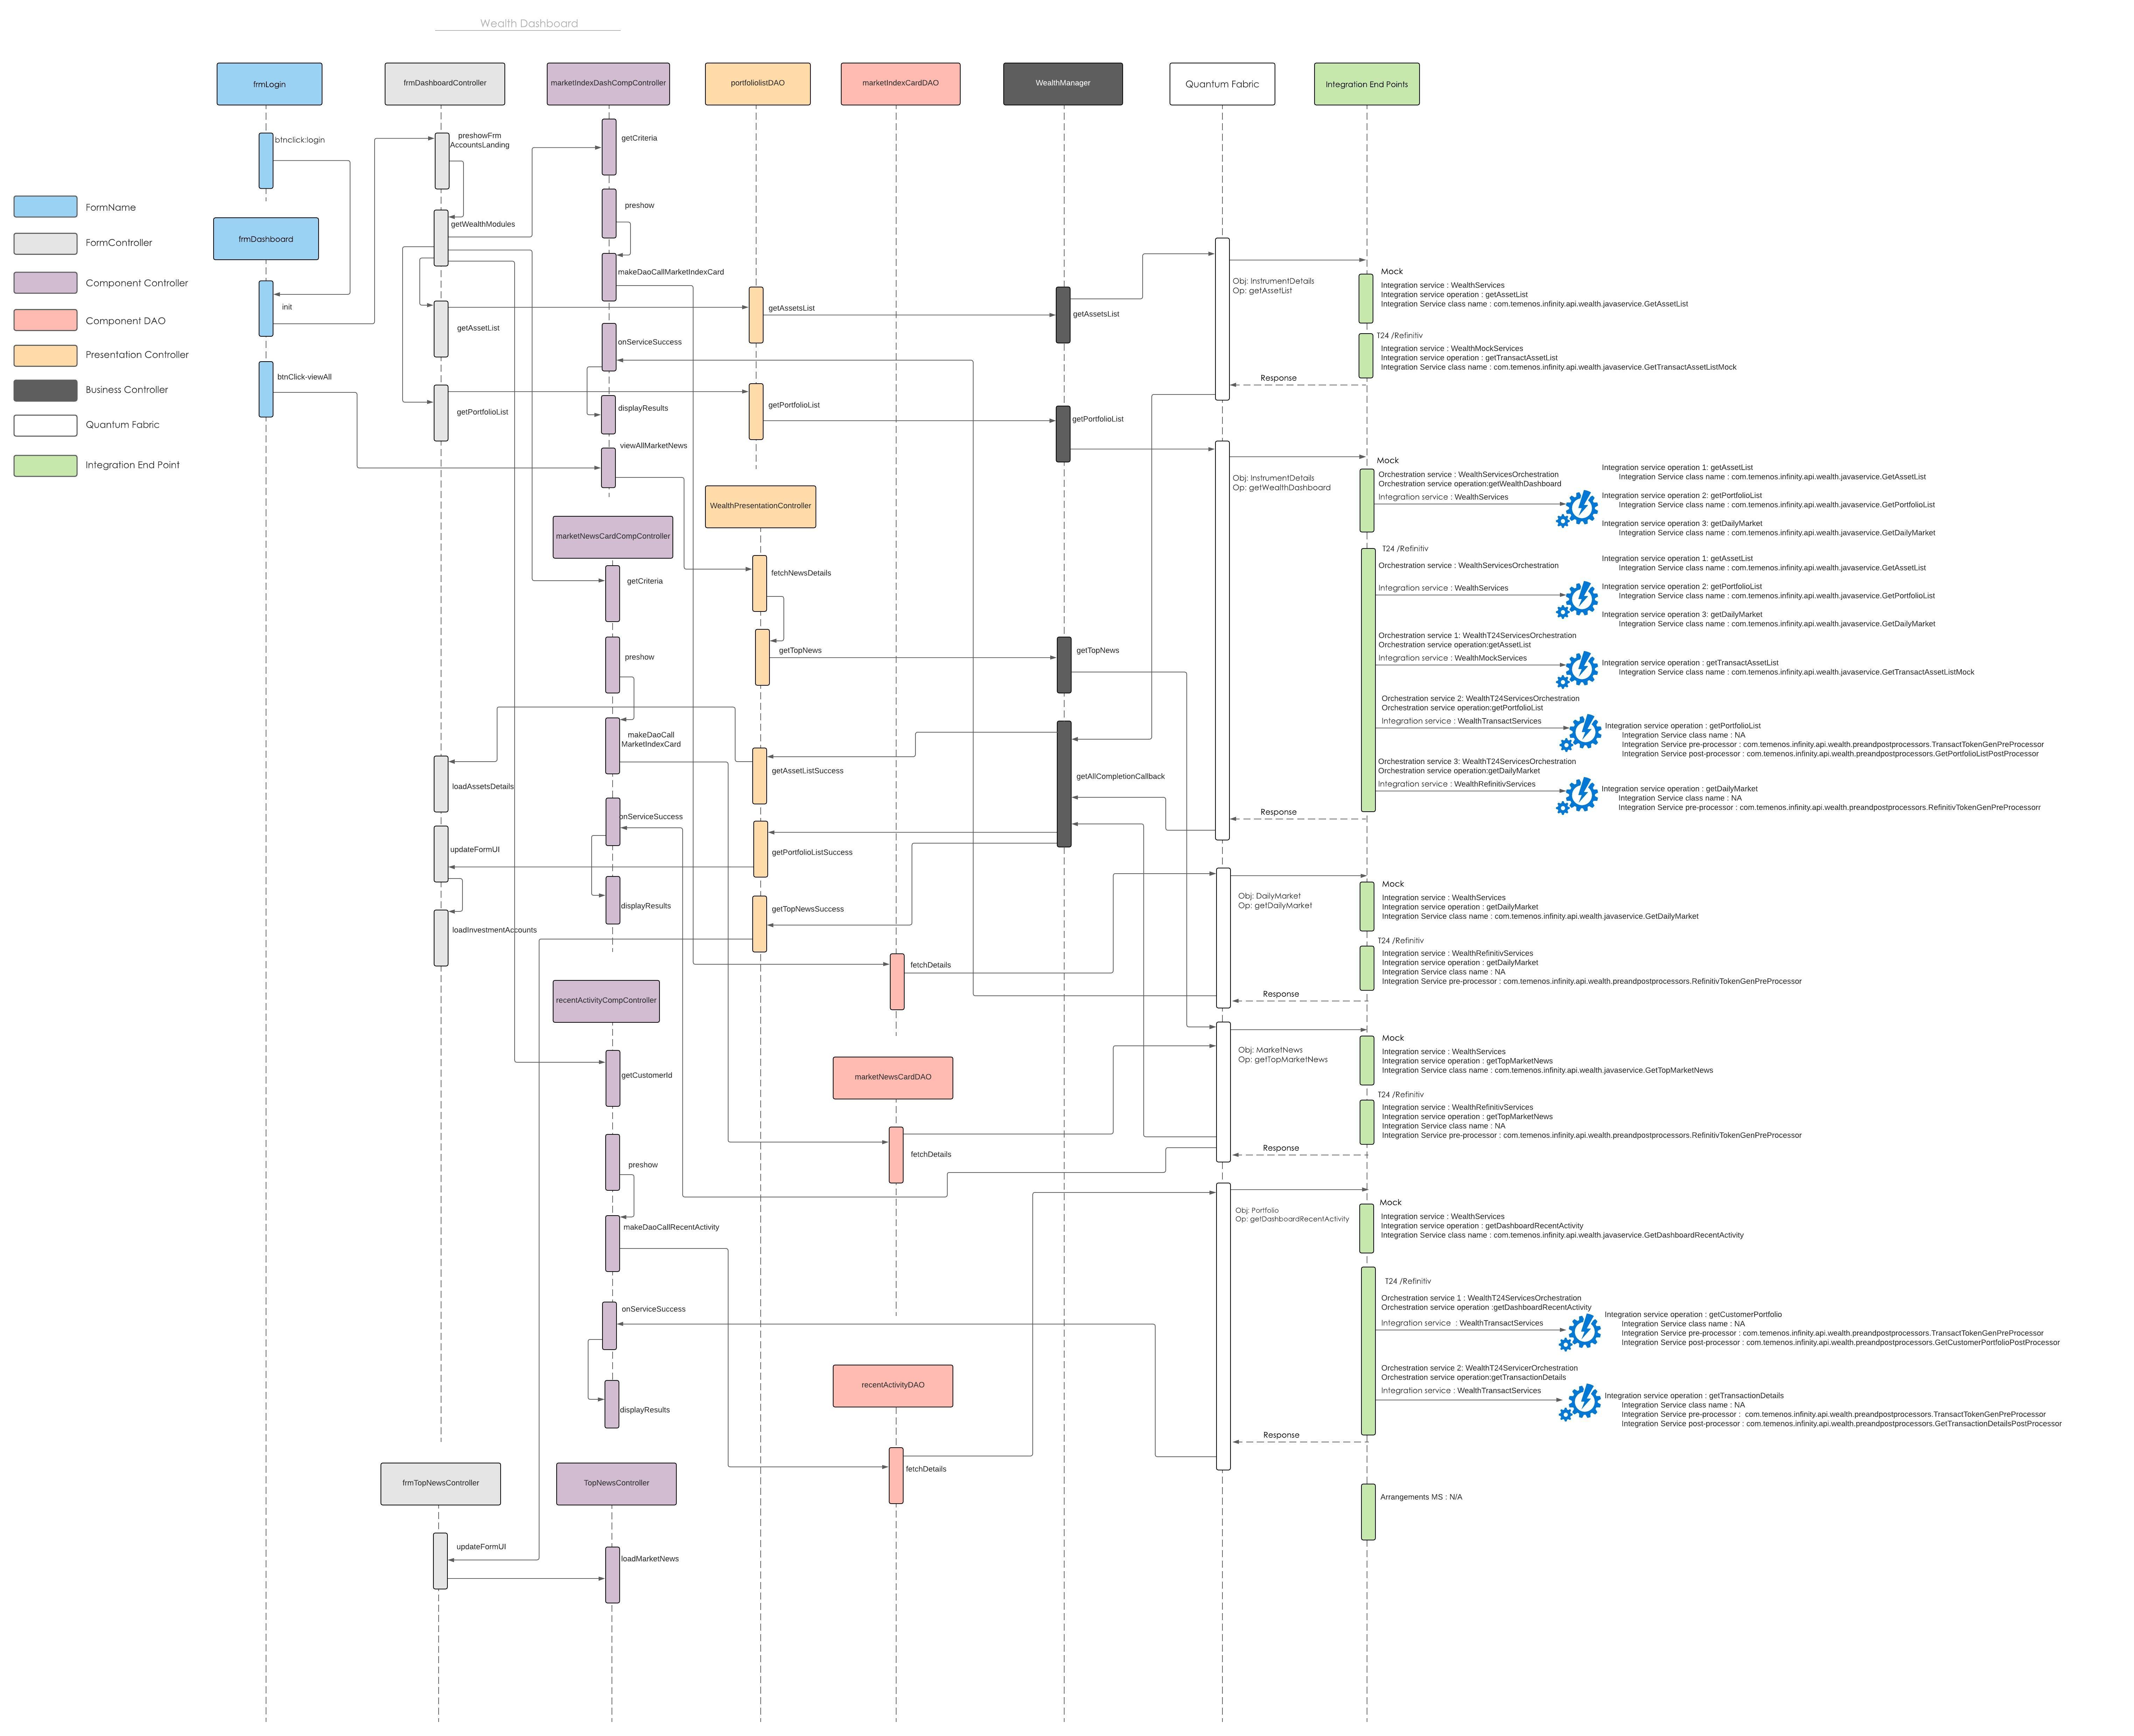
Feature Description
The Wealth Dashboard displays your investment summary and details of the other bank accounts. From the landing page, you can navigate to the subsequent sections of the wealth functions.
The below section provides detailed information about each feature on the Accounts Dashboard and Home screen of the Online Banking and Mobile Native App.
Total Assets
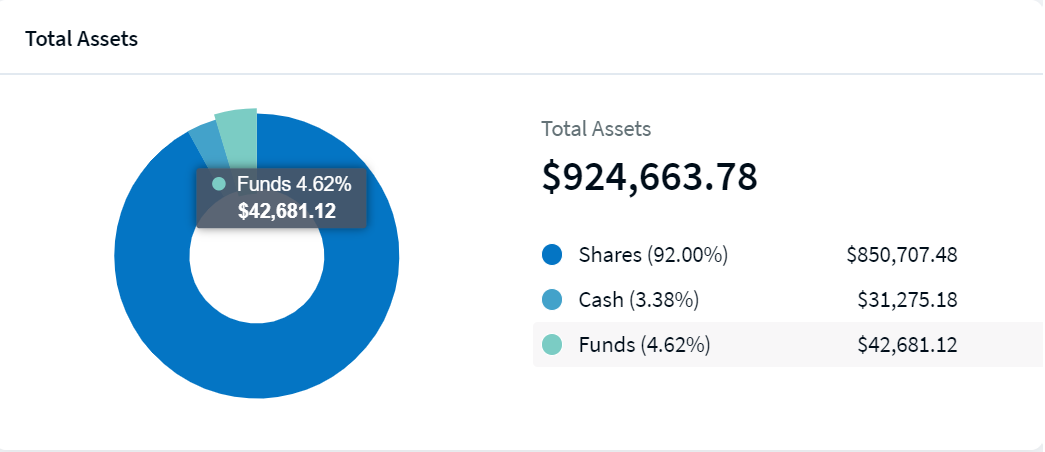
Online Banking: The Total Assets feature displays your assets, which are categorized into different asset classes, which includes Investment Cash Accounts, Savings Accounts, and Checking Accounts. It displays the accounts of which you are the primary account holder.
The allocation is displayed in the form of a pie chart. It also displays the total value of the assets, the list of assets, and the respective values and proportion percentages.
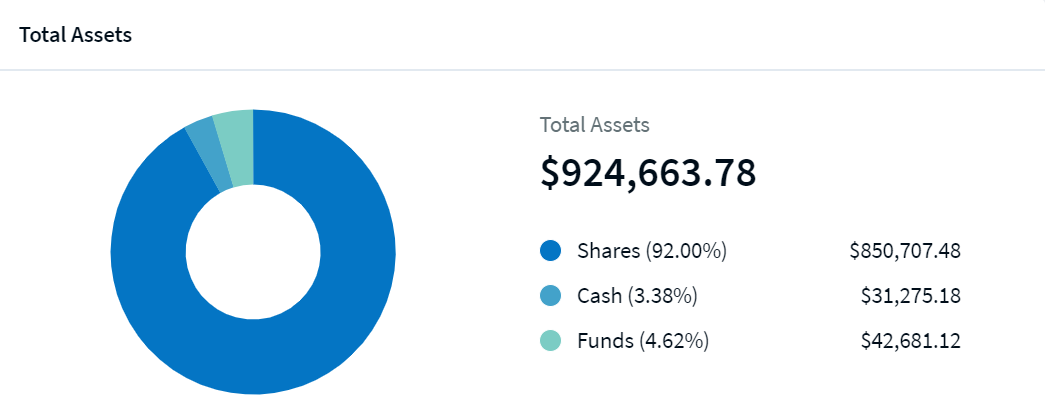
On hovering over the graph, the corresponding asset class is highlighted in the list and magnified in the graph.
Mobile Native App:You can view the Total Asset feature on the Home screen, where you can find the total value of the assets and the consolidated performance percentage value of your investments and portfolios. Profit is displayed in Green, and the loss is displayed in Red.
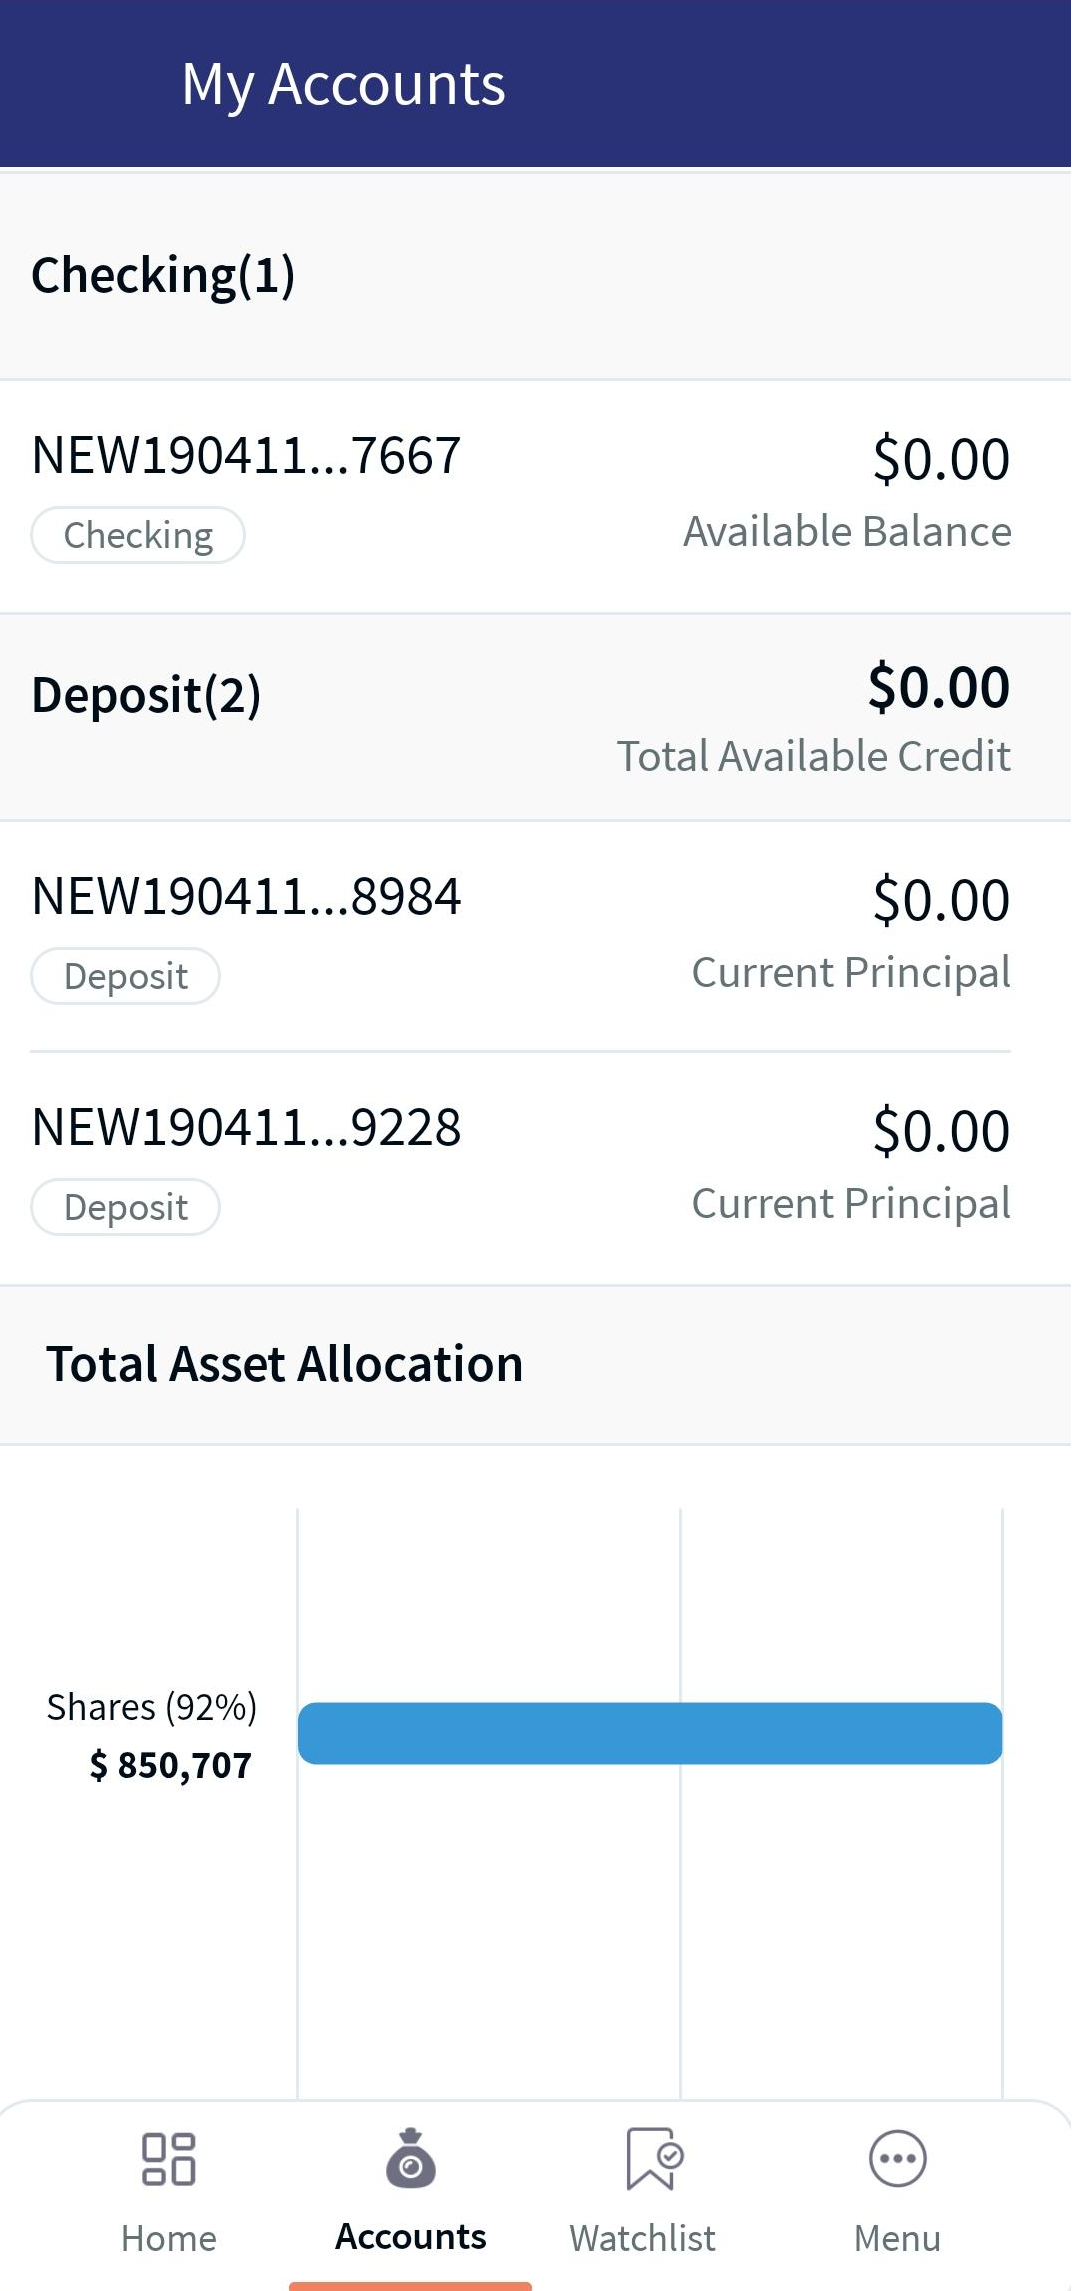
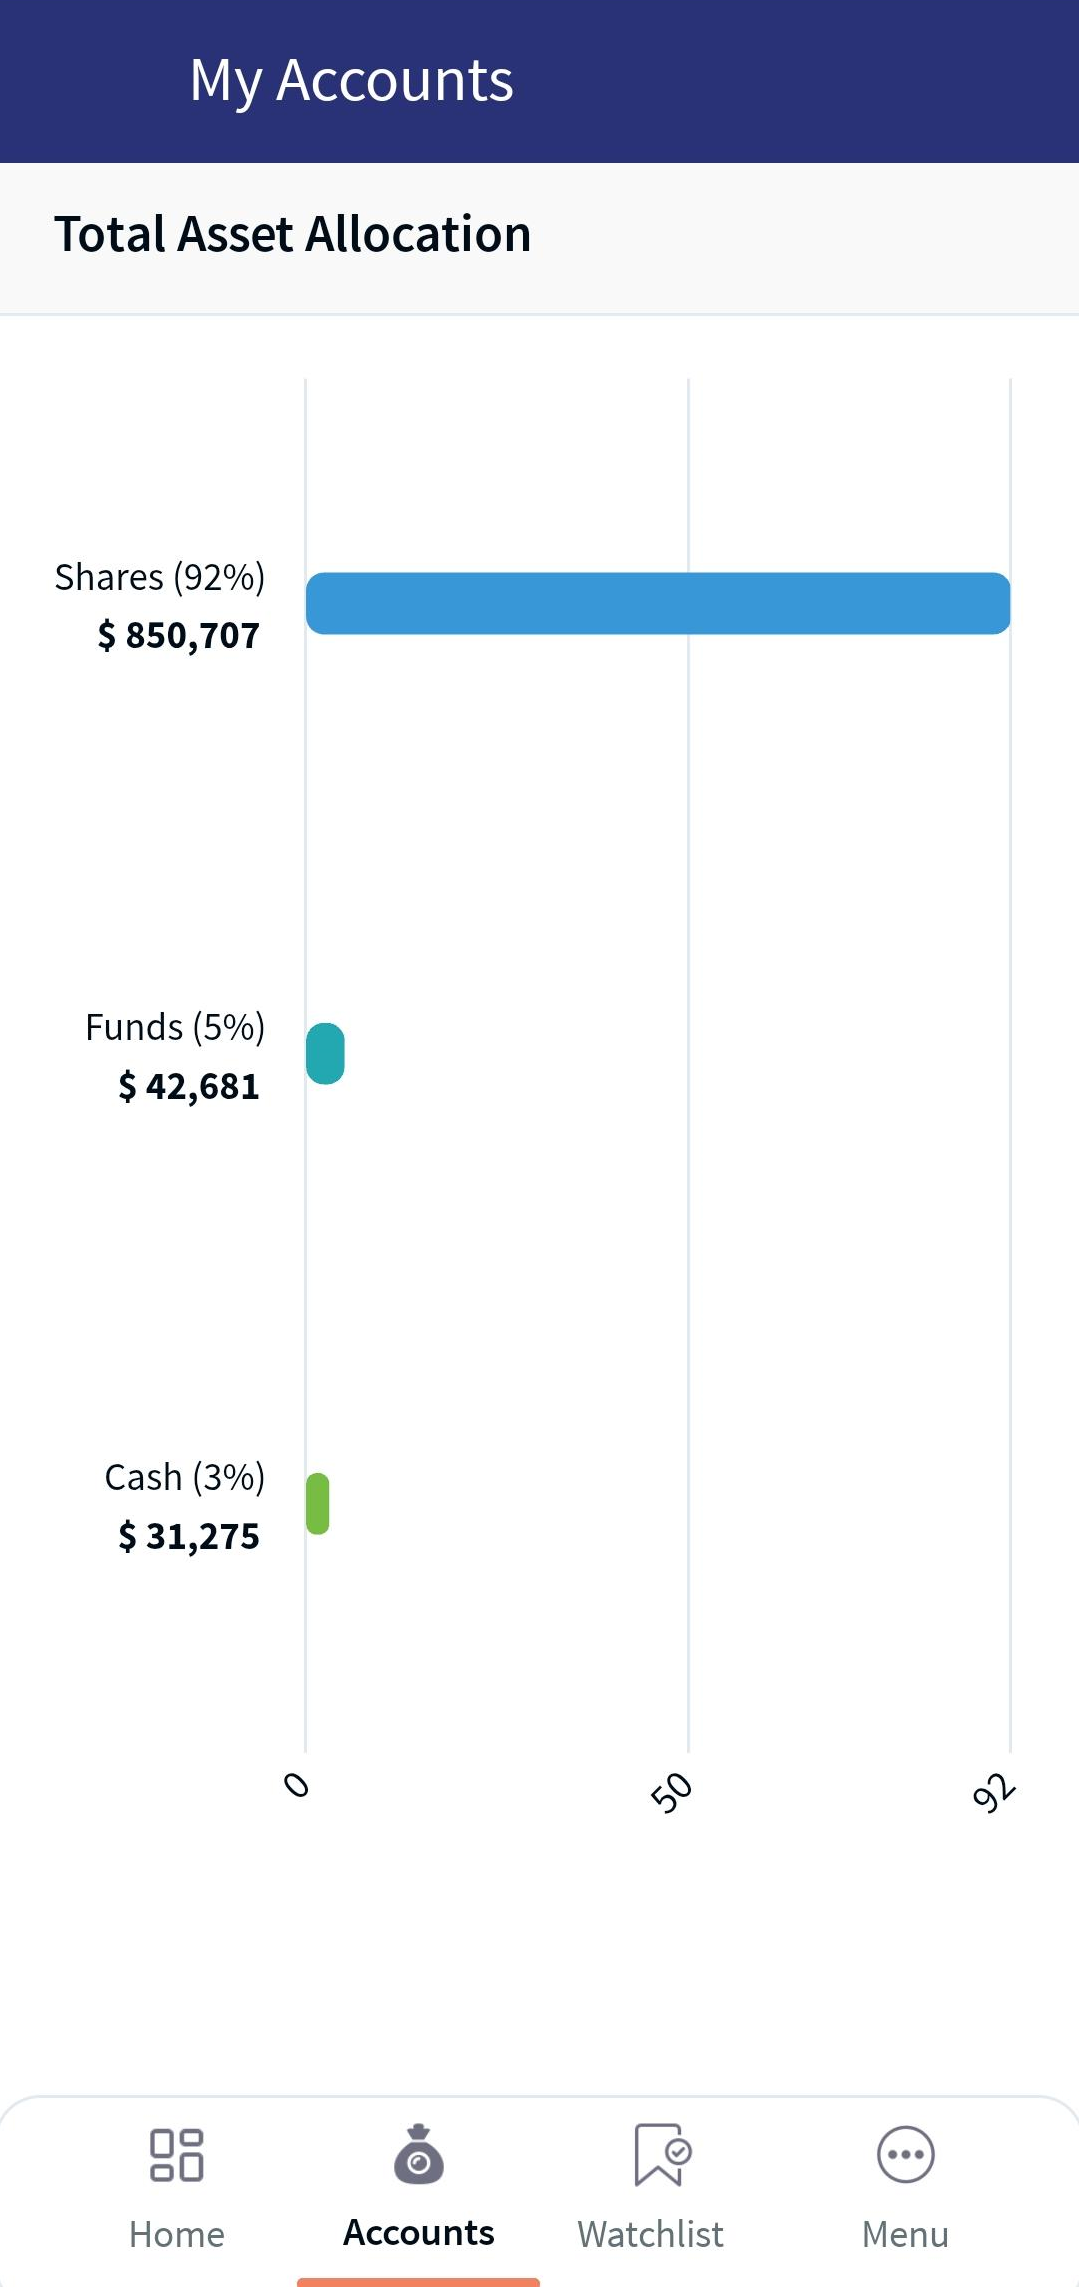
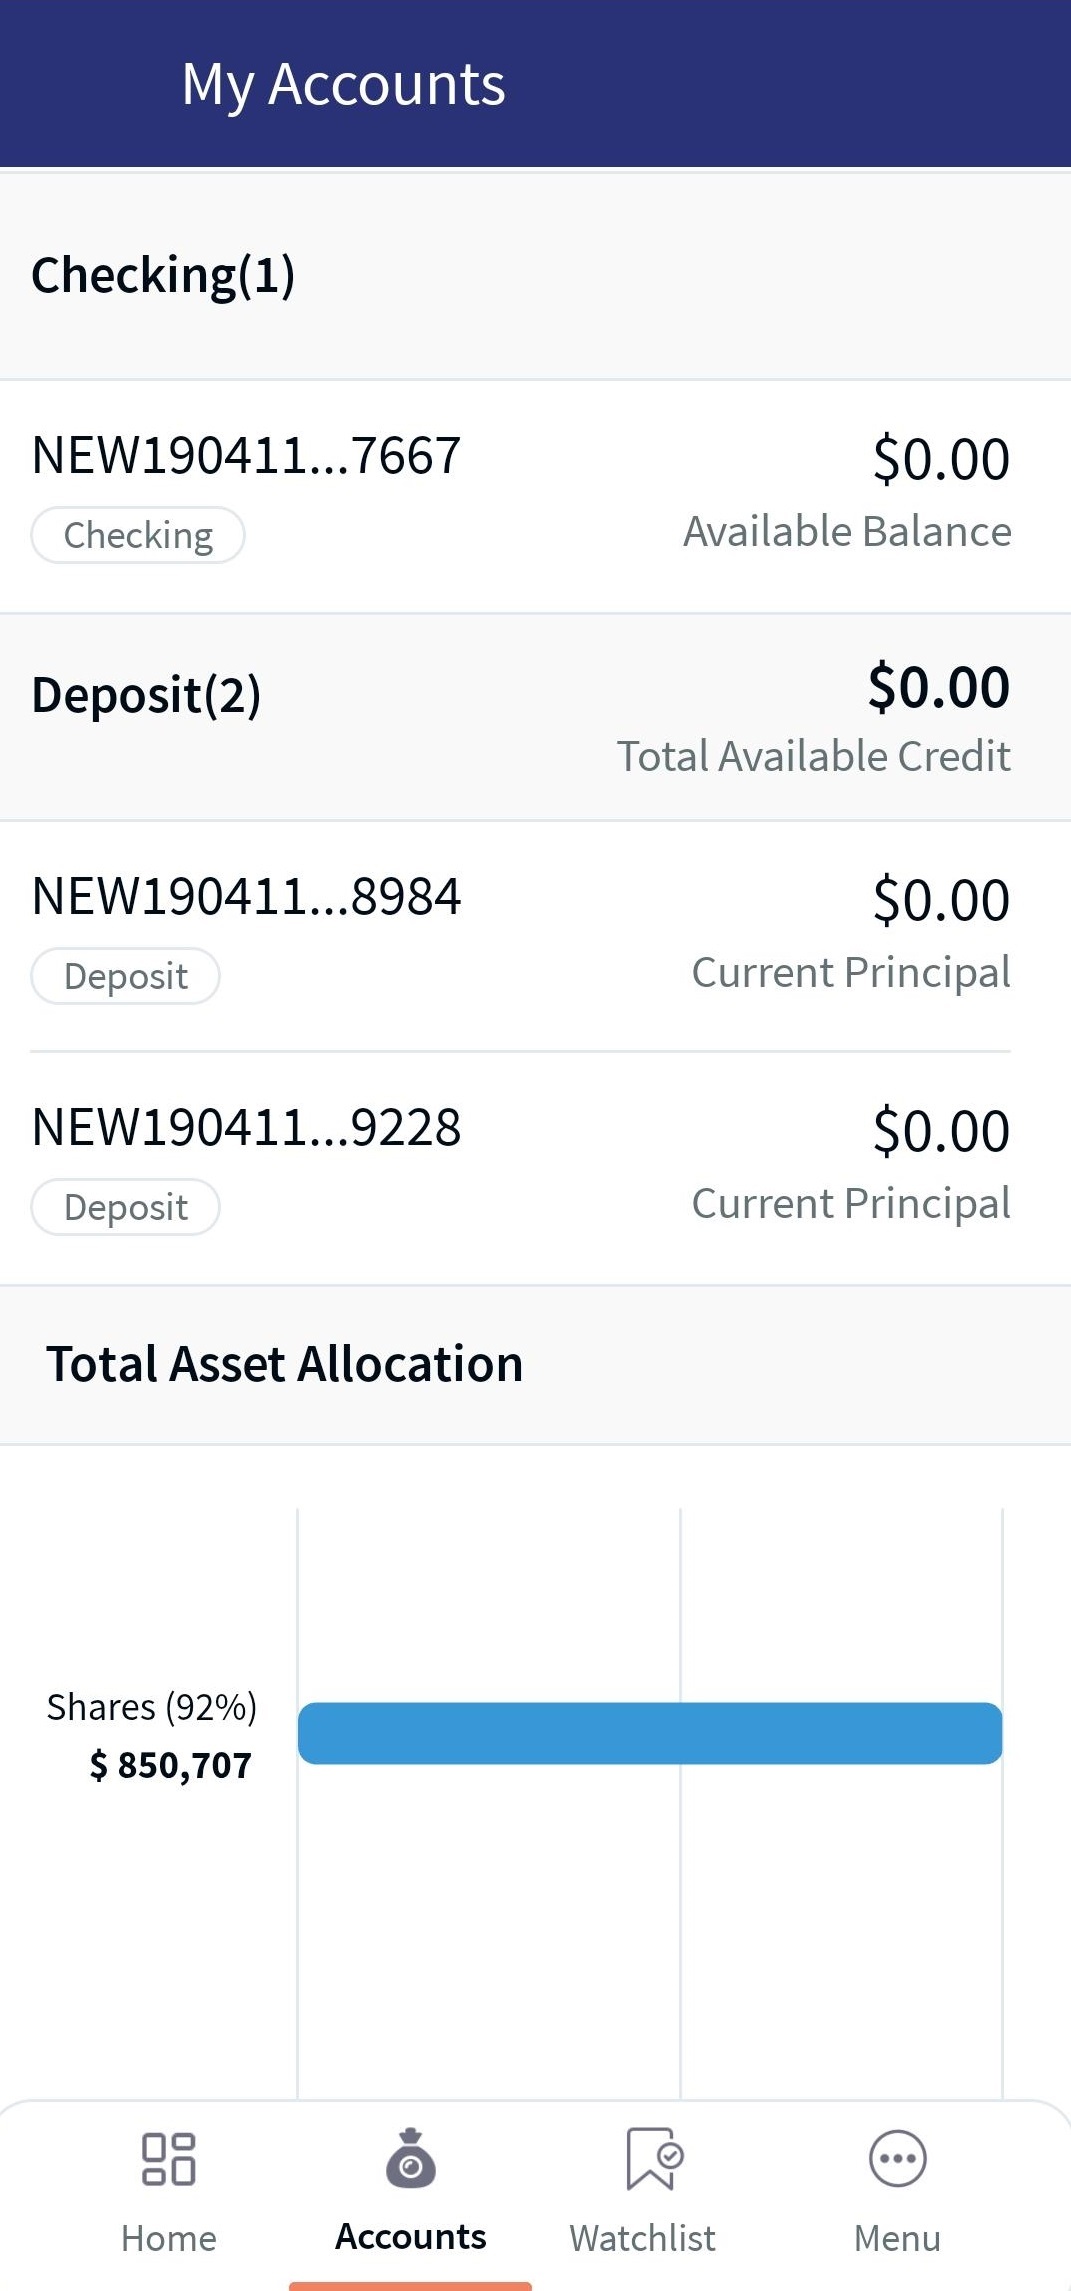
On clicking the Total Asset Value card, you are navigated to the My Accounts screen, where the Accounts icon at the bottom gets highlighted. The user can view detailed analytics of the list of assets, the respective values, and proportion percentages for the Investment Cash Accounts, Savings Accounts, and Checking Accounts in a bar chart.
My Investment Summary
Online Banking: Investment Summary displays a consolidated overview of your investments and portfolios. It displays the evolution of your accounts over the past months along with the following details:
- The total value of your investments
- Unrealized P&L: Specifies the difference between the current market value and the weighted average cost of the buy. Profit is displayed in Green and the loss is displayed in Red.
- Performance: Specifies the consolidated performance percentage value of your investments and portfolios. Profit is displayed in Green and the loss is displayed in Red.
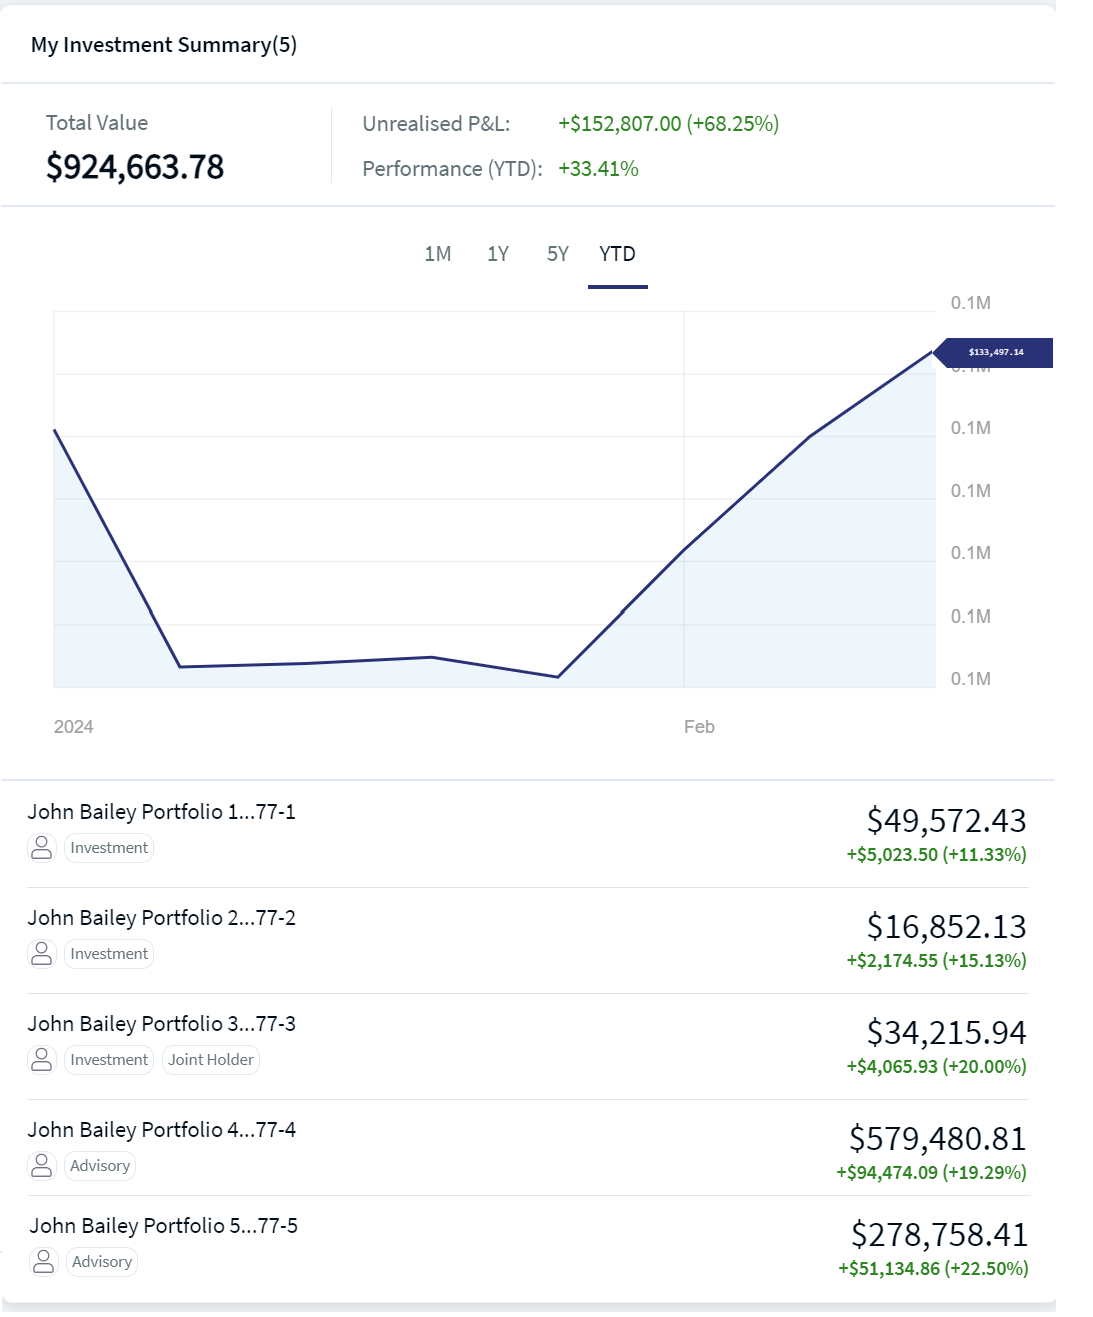
You can select the time period for which you can view your investments. The predefined time periods are as follows:
- 1M: The graph displays the details for the last month from the current day.
- 1Y: The graph displays the details for the last year from the current day.
- 5Y: The graph displays the details for the last five years from the current day.
- YTD: The graph displays the details from the beginning of the year to the current day.
On hovering over the graph, the corresponding investment details at a particular time are displayed.
Investment Summary also displays the list of investment accounts with their respective value and gain or loss. You can also place a trade and view the details of your investments. When you click an investment account, the Investment Account page appears, which contains details about the account. For more information about an instrument, click here.
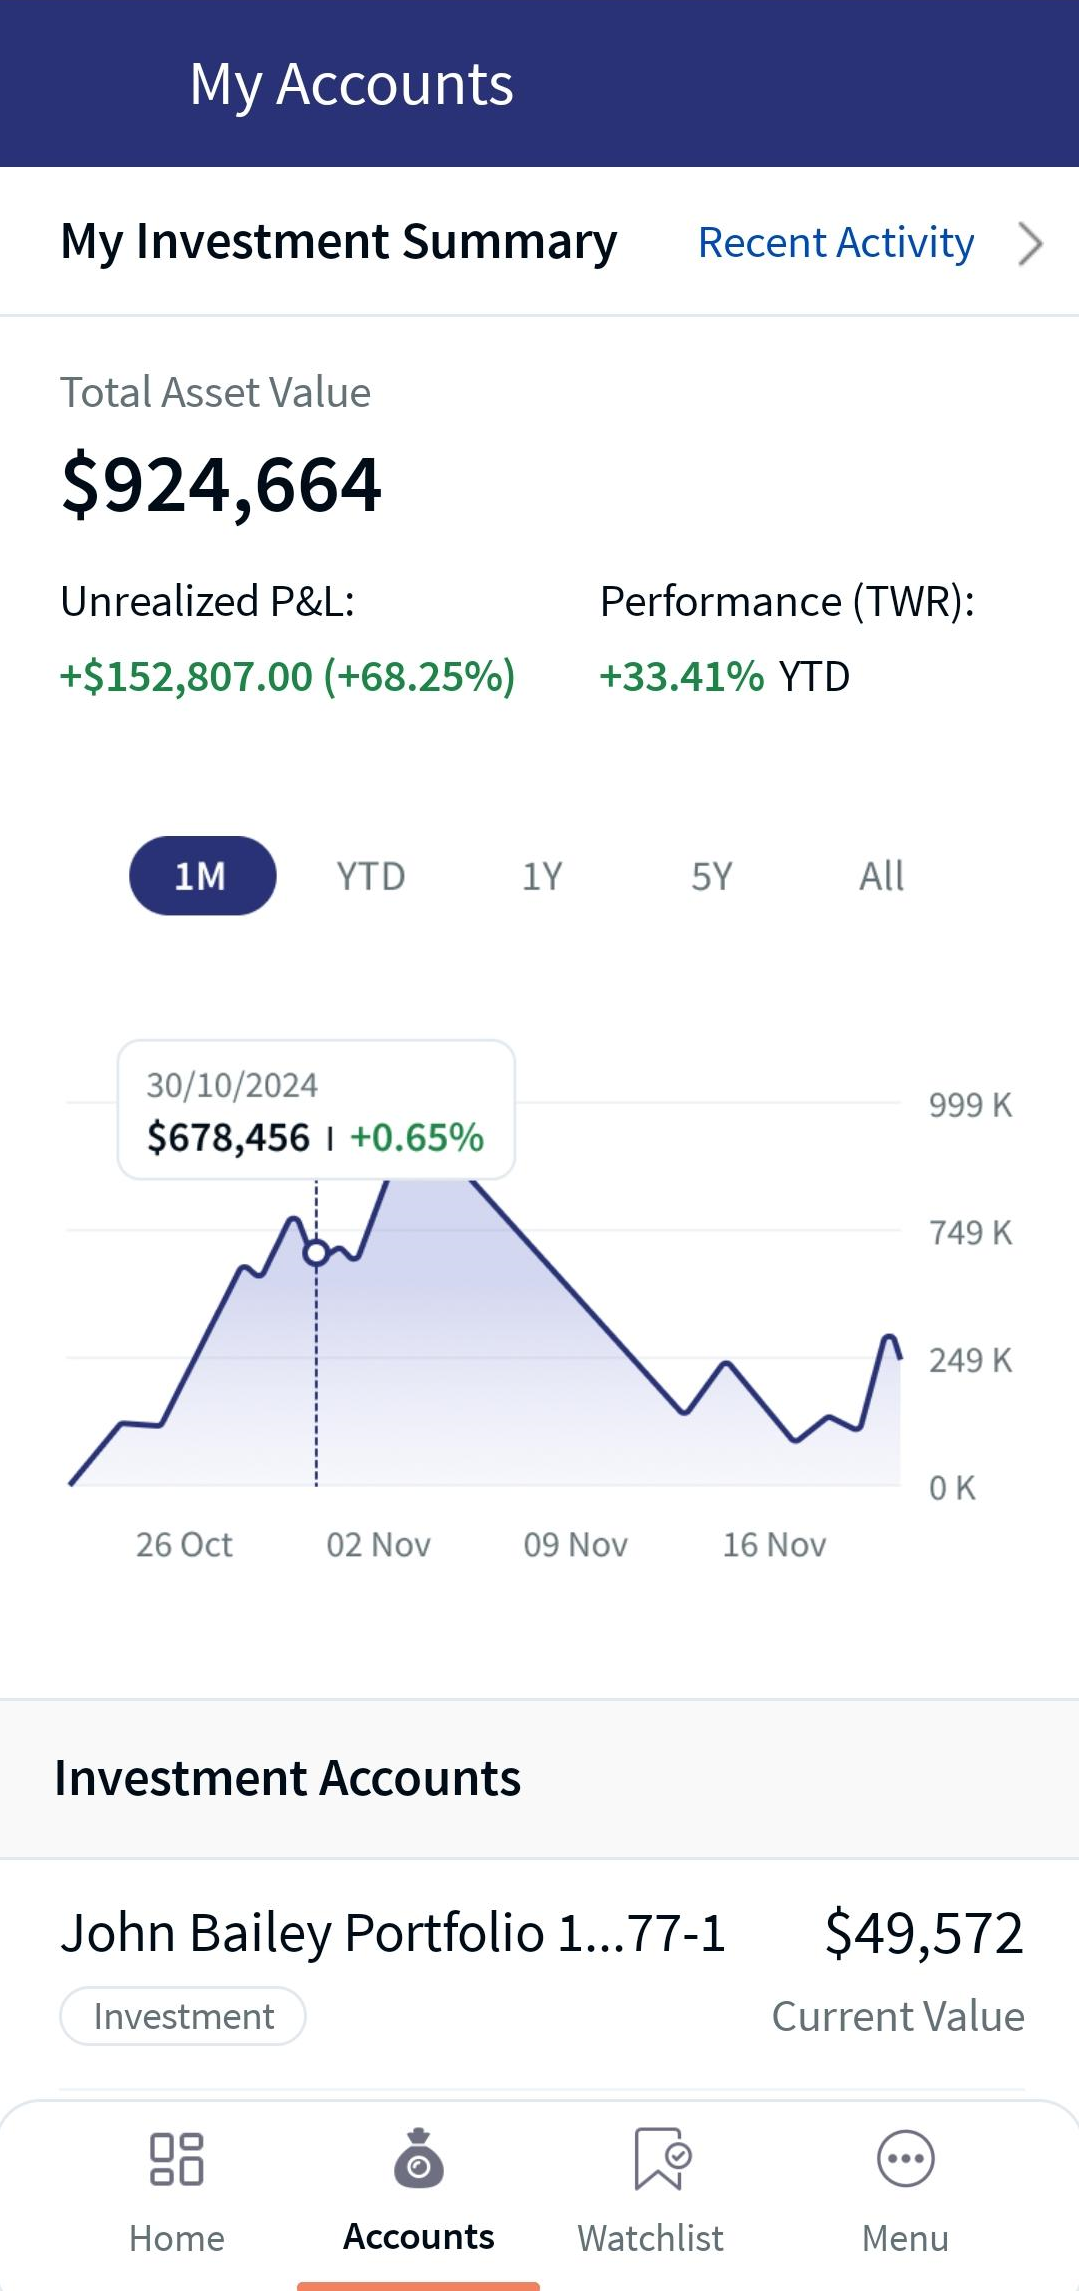
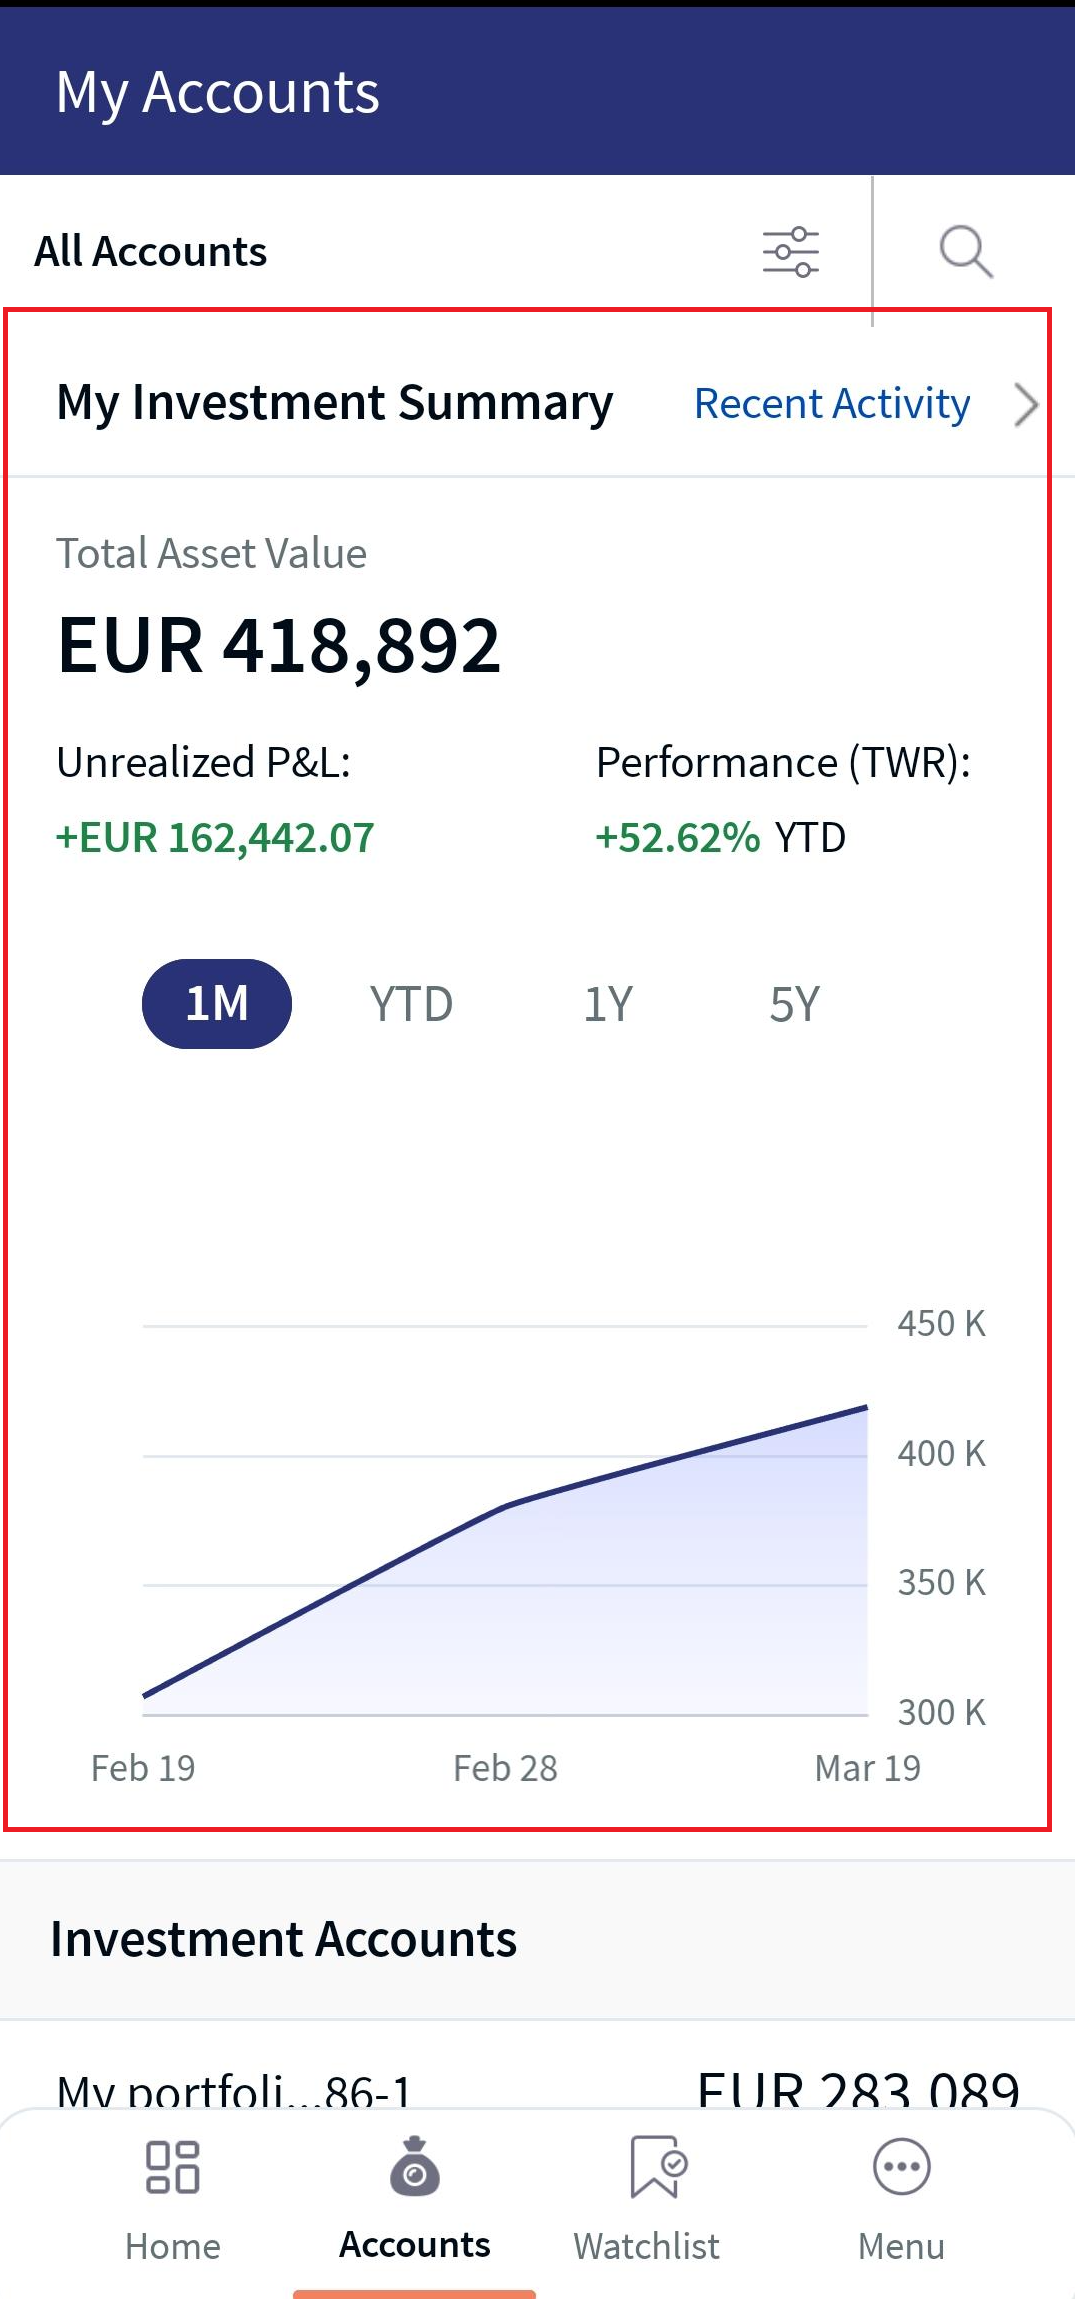
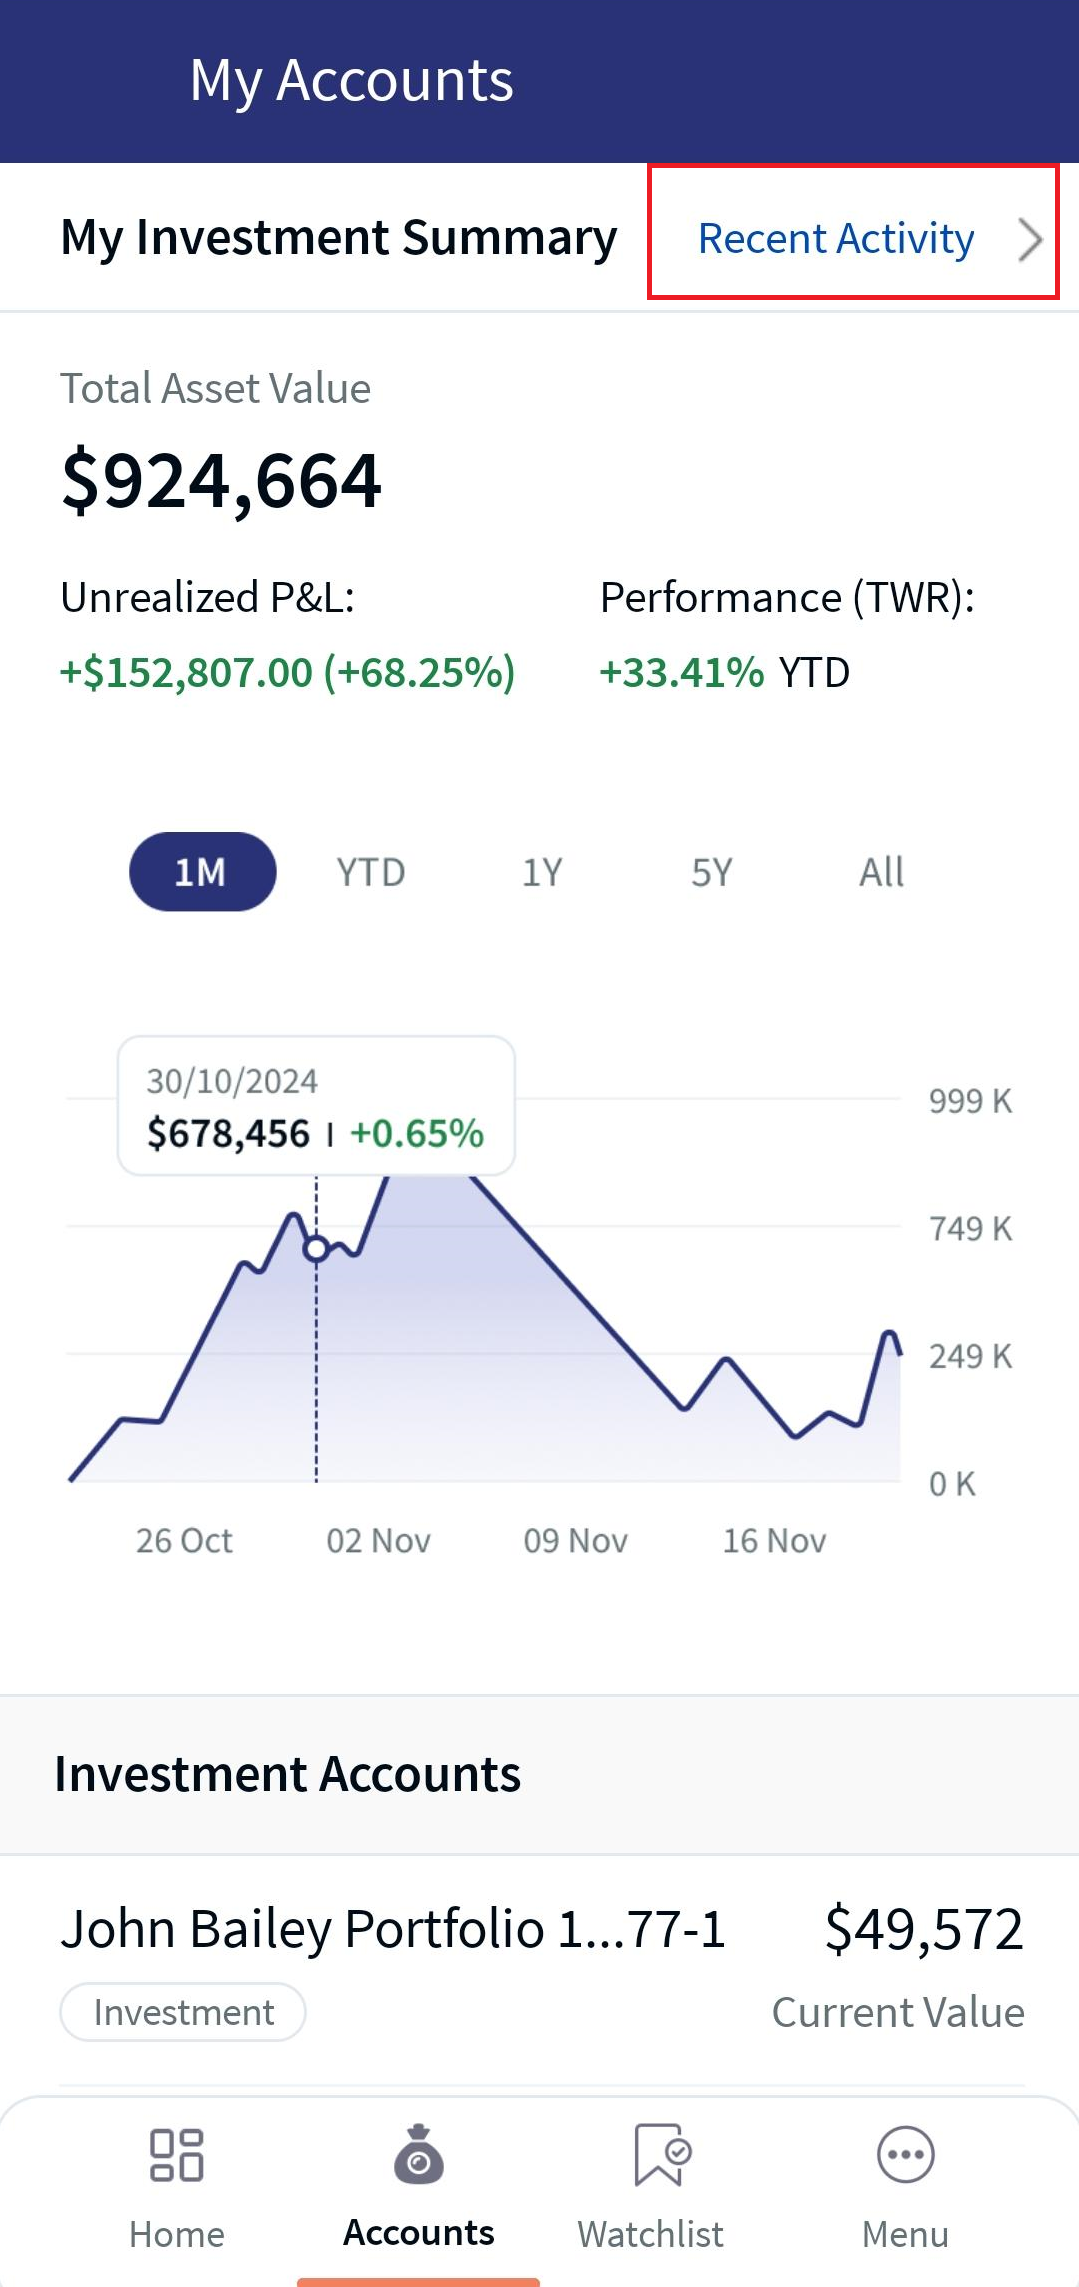
Mobile Native App: The Investment Summary feature is displayed when you click on the Accounts icon. This feature allows you to view the recent activity, the total asset value, unrealised PL, investment accounts, investment summary graph, total asset allocation, and performance metrics (TWR).
My Investment Summary graph displays a consolidated overview of the customer's investments and portfolios. You can select the time period for which you can view your investments.
Below are predefined time periods and graph intervals, which are customized and are configured as per locale.
- 1M: The graph displays the details for the last month from the current day.
- 1Y: The graph displays the details for the last year from the current day.
- YTD: The graph displays the details from the beginning of the year to the current day.
- 5Y: The graph displays the details for the last five years from the current day.
On hovering over the graph, you can view the total value, date, and performance metric in percentage for the selected time frame.
The table below briefs about the graph intervals displayed at various integrations.
| Integrations | 1 M | 1 Y | YTD | 5Y |
| Mock | Daily Values | Month End Values | Month End Values | Semi-Annual Values |
| Wealth FO | Month End Values | Month End Values in the plotted area. | Month End Values in the plotted area | Semi-Annual Values |
In addition to the Investment Accounts, Retail Accounts such as Loan Accounts, Deposits, Savings Accounts, and the Current Account are displayed. For a detailed description, refer to Personal Accounts.
Today's Market
Online Banking: In the Digital Wealth app, Today's Market briefs you about the market movements (i.e., the current state of financial markets), providing real-time data about key market indicators such as stock market indices, stocks - top gainers and losers, sector performance, and your portfolio performance.
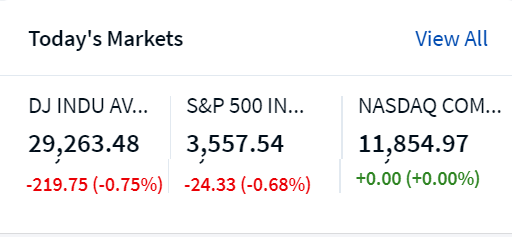
This section displays the global indices along with the index value, the gain or loss for the day, and the percentage of gain or loss.
When you click View All, the Top News section appears. For more information on Top News, click here.
Mobile Native App: Today's Market feature appears on the Home screen. This feature allows you to view the market indices name, date, and the total price, including high and low prices. It also displays the day's gain or loss with an arrow symbol. The Gain or Upward arrow is green, and the Loss or Downward arrow is red.
This feature is swipeable with three cards, displaying the stocks - top gainers and losers.
Top News
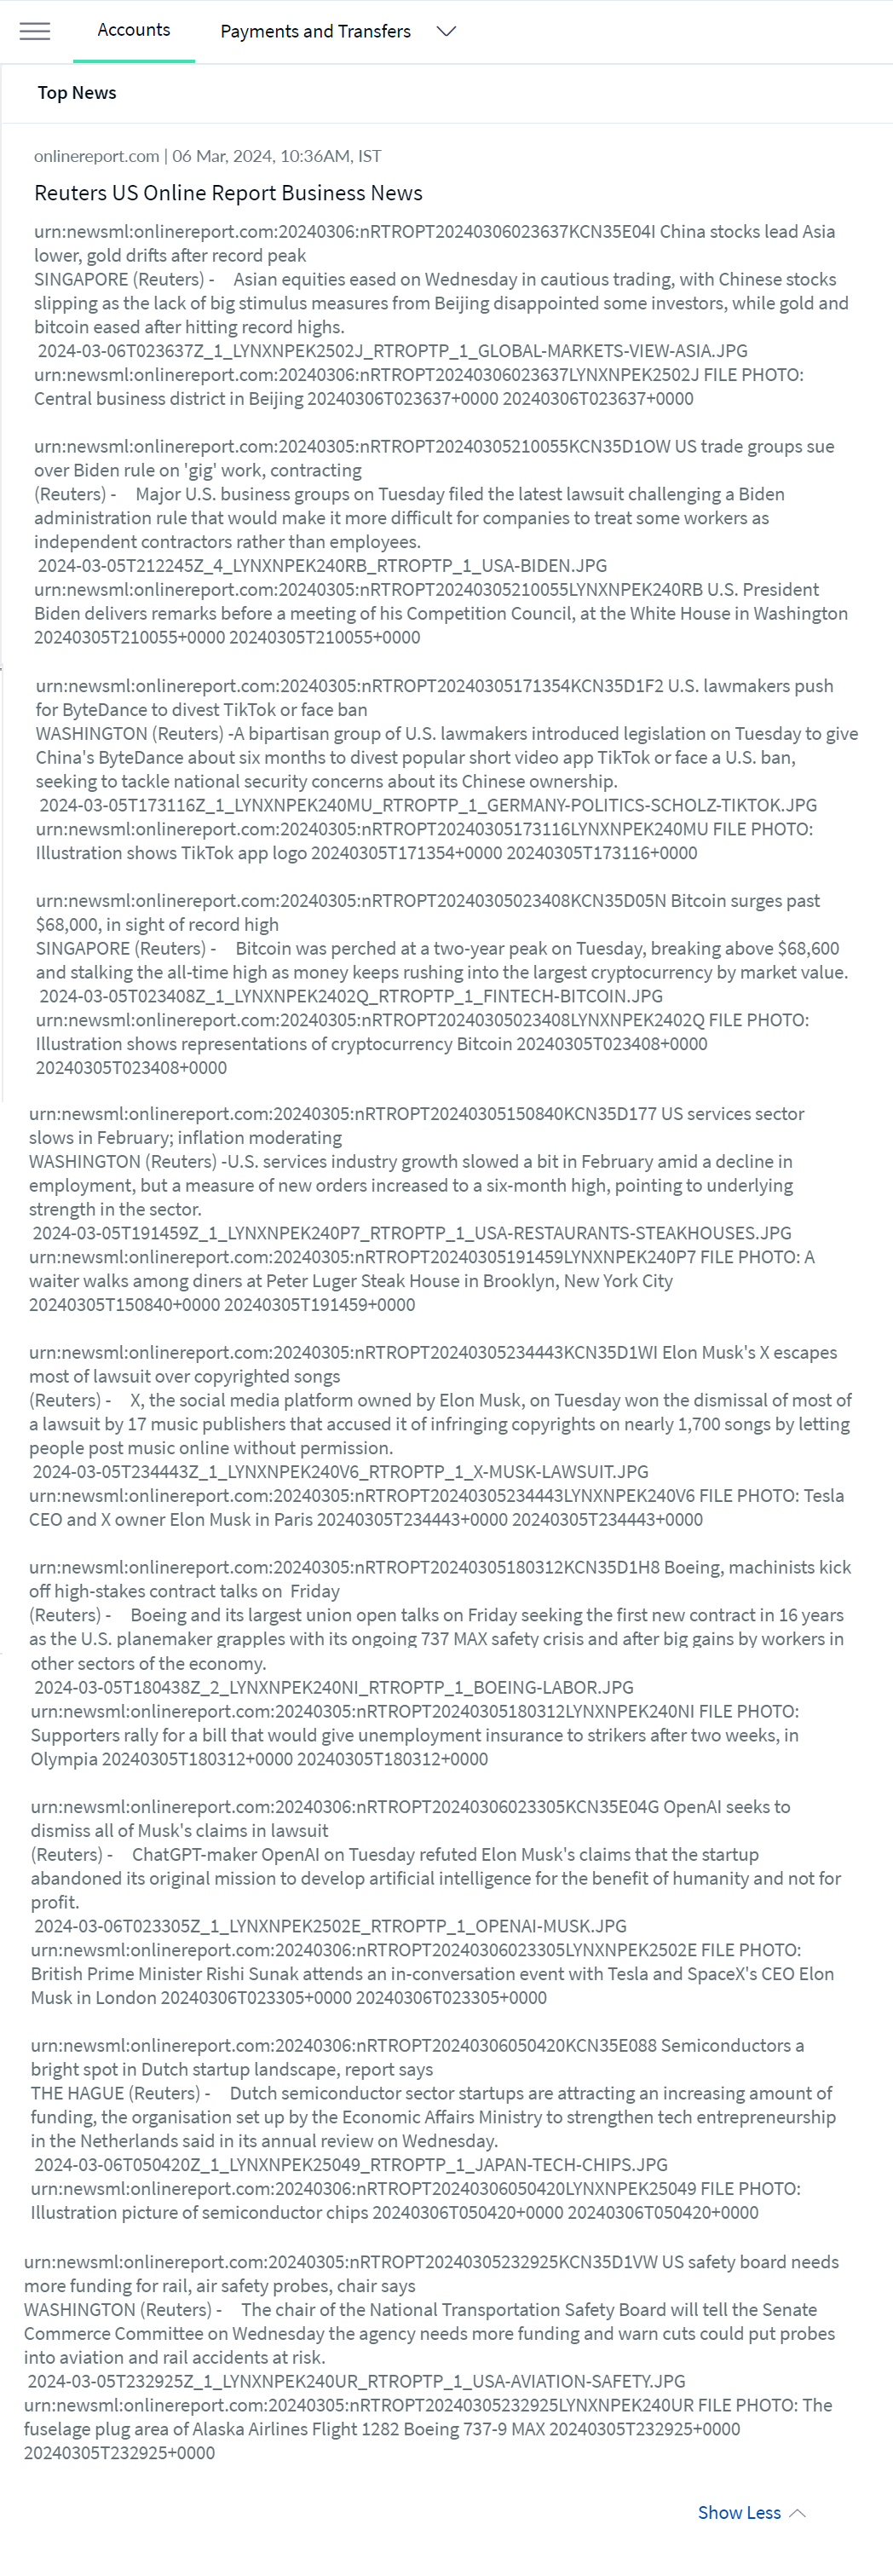
Online Banking: The Top News allows you to view the latest market trends, financial updates, and the relevant economic events impacting your investments. The Top News feature in Digital Wealth app displays a list of current news as shown below.
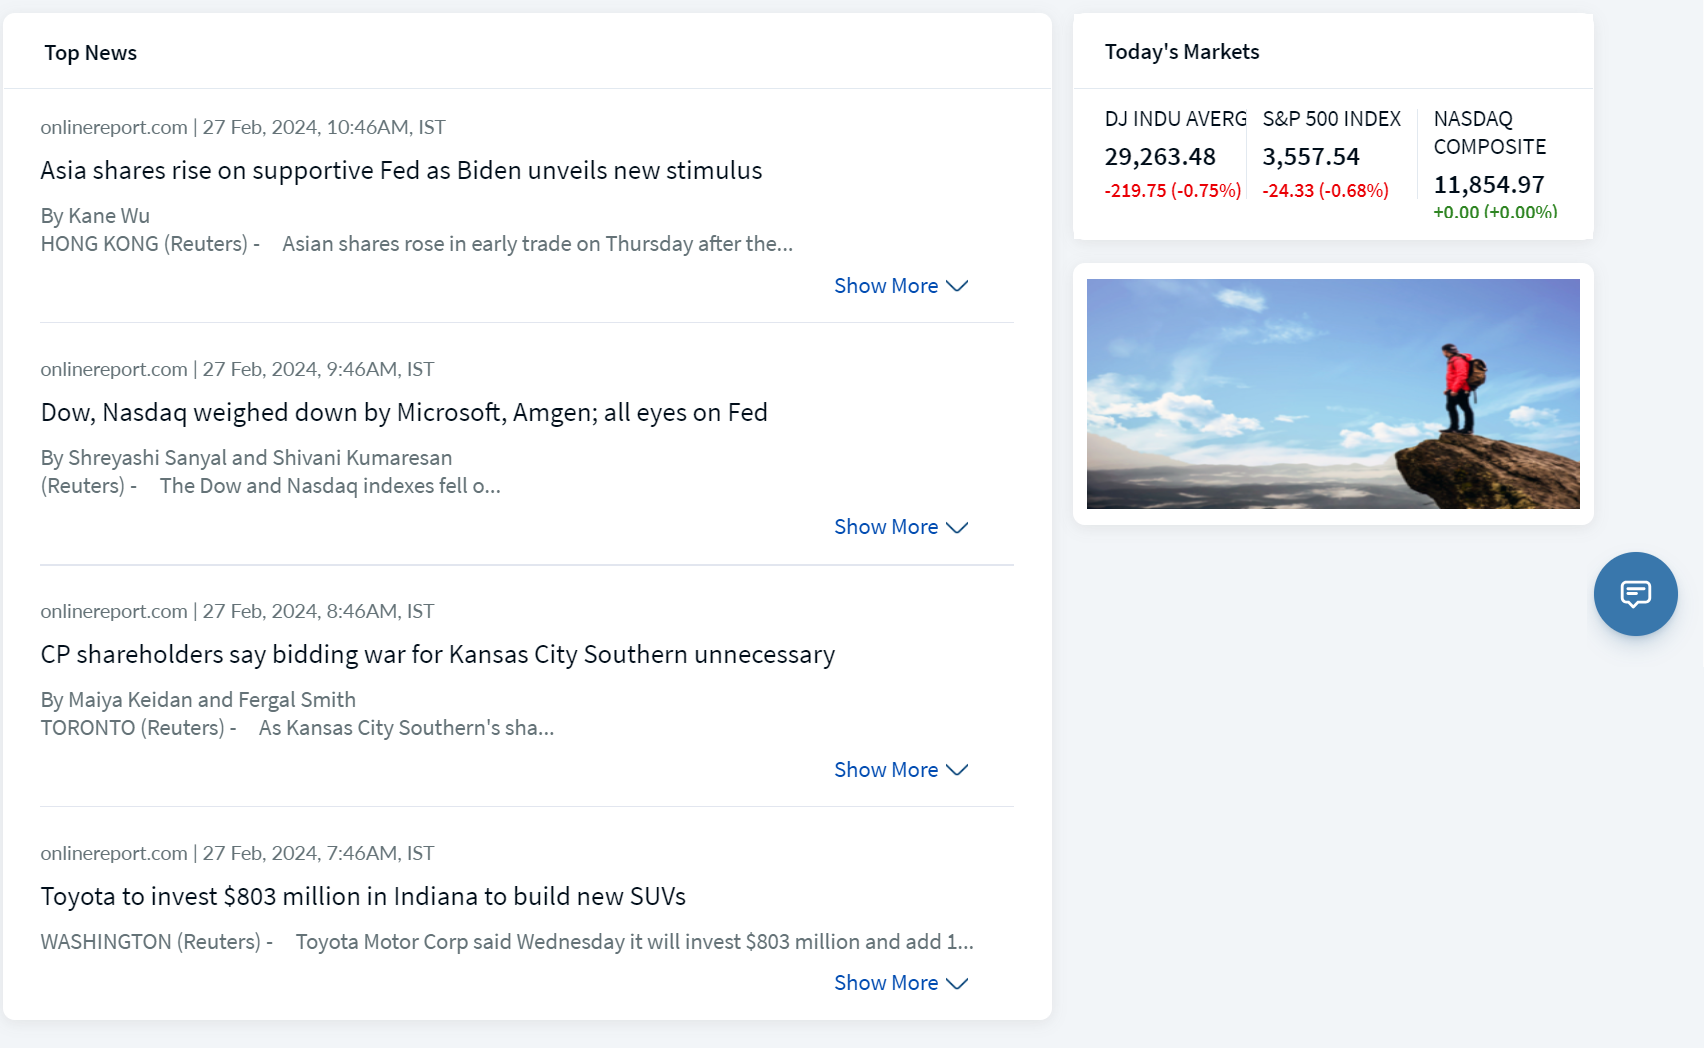
You can view the details of every news item by clicking the Show More option. The news feed is fetched from the Market Data Provider.
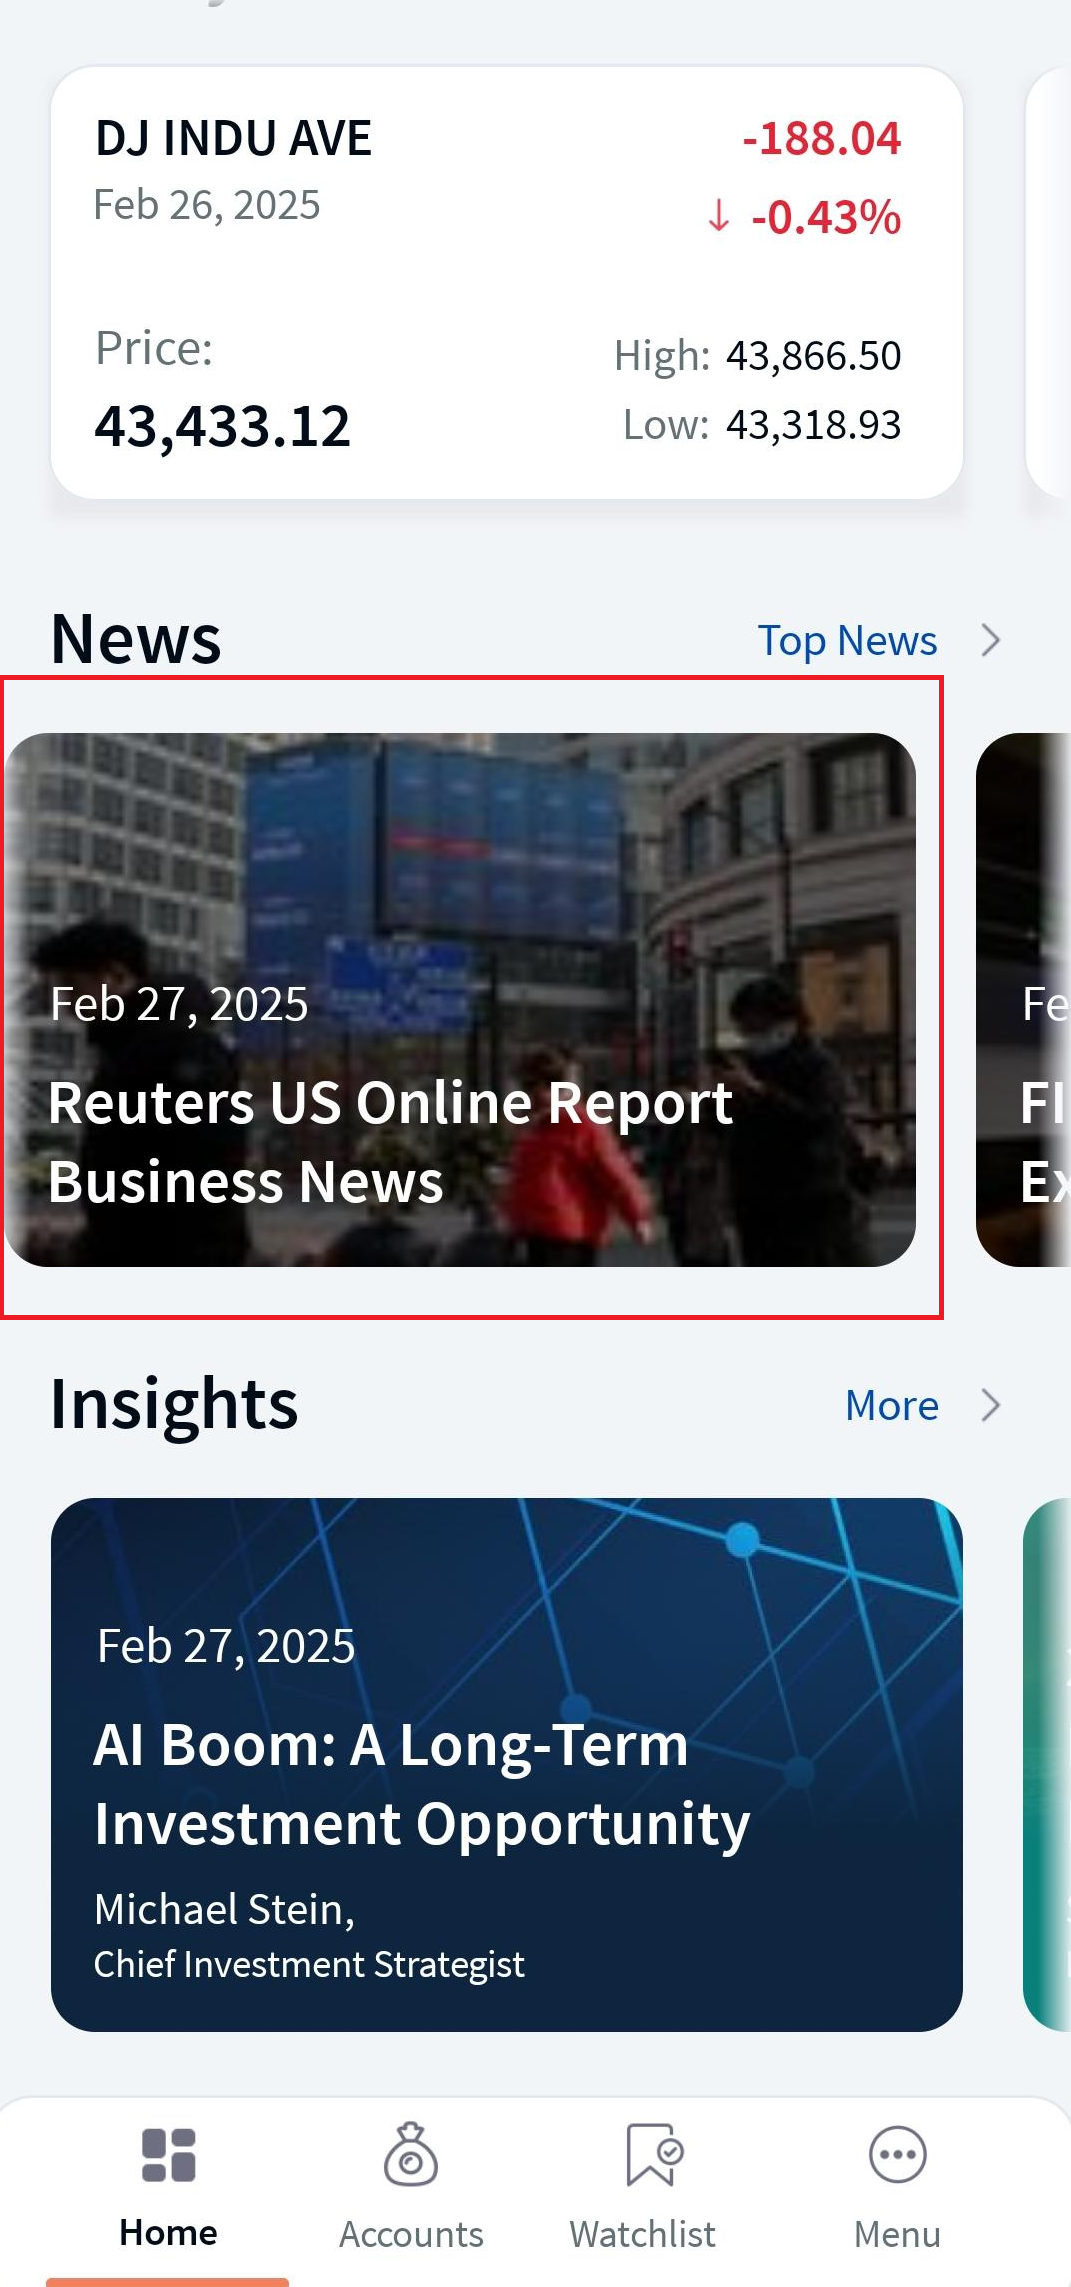
Mobile Native App: Top News feature displays the current market news and the news related to trading instruments such as stocks, bonds, commodities etc, which is swipeable. A “Top News” link is displayed if more than three articles are available. On clicking, you can view a list of Top News. Select and click on any article to view the detailed information.
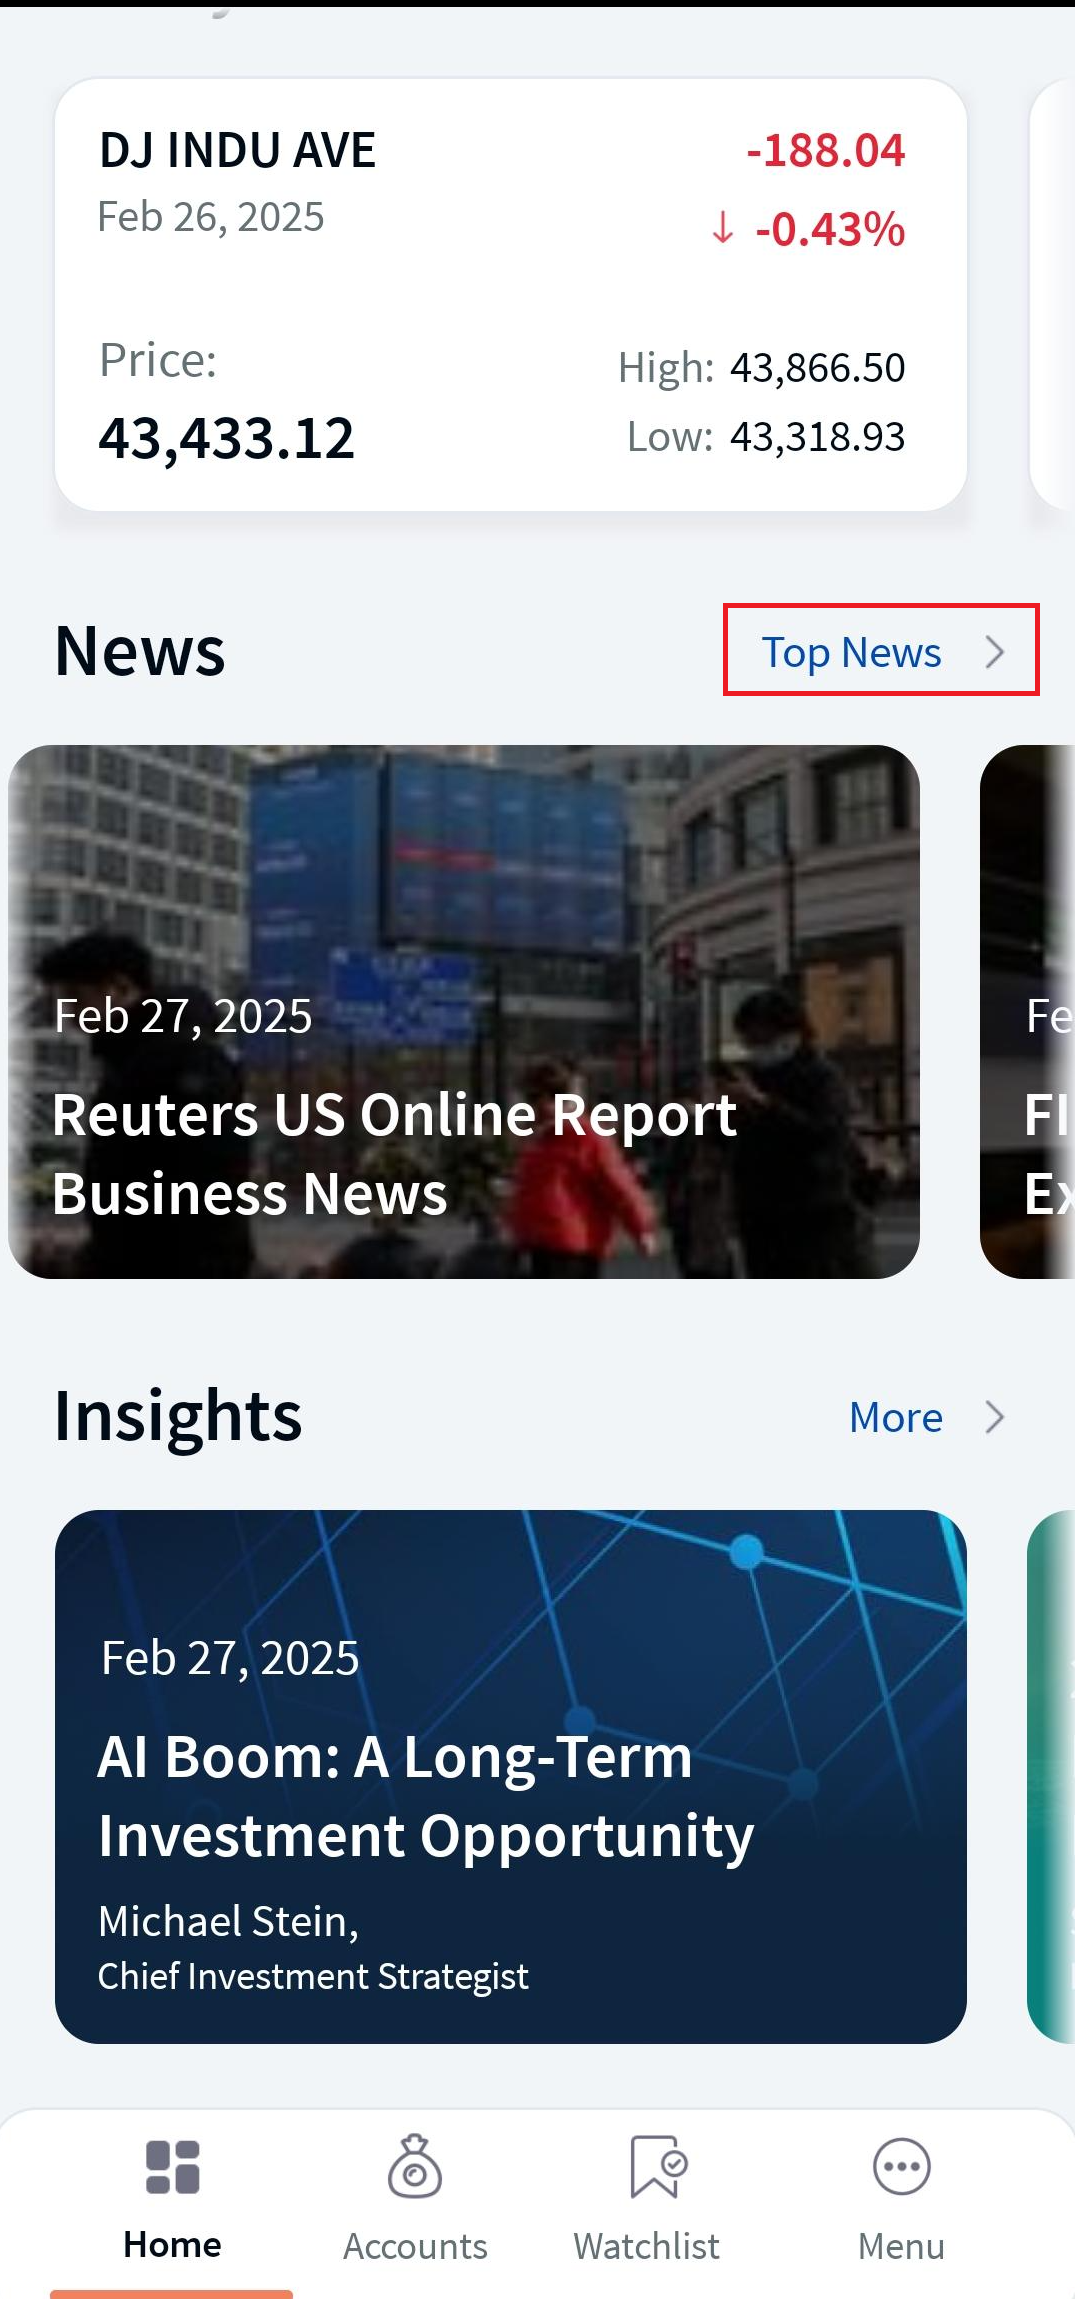
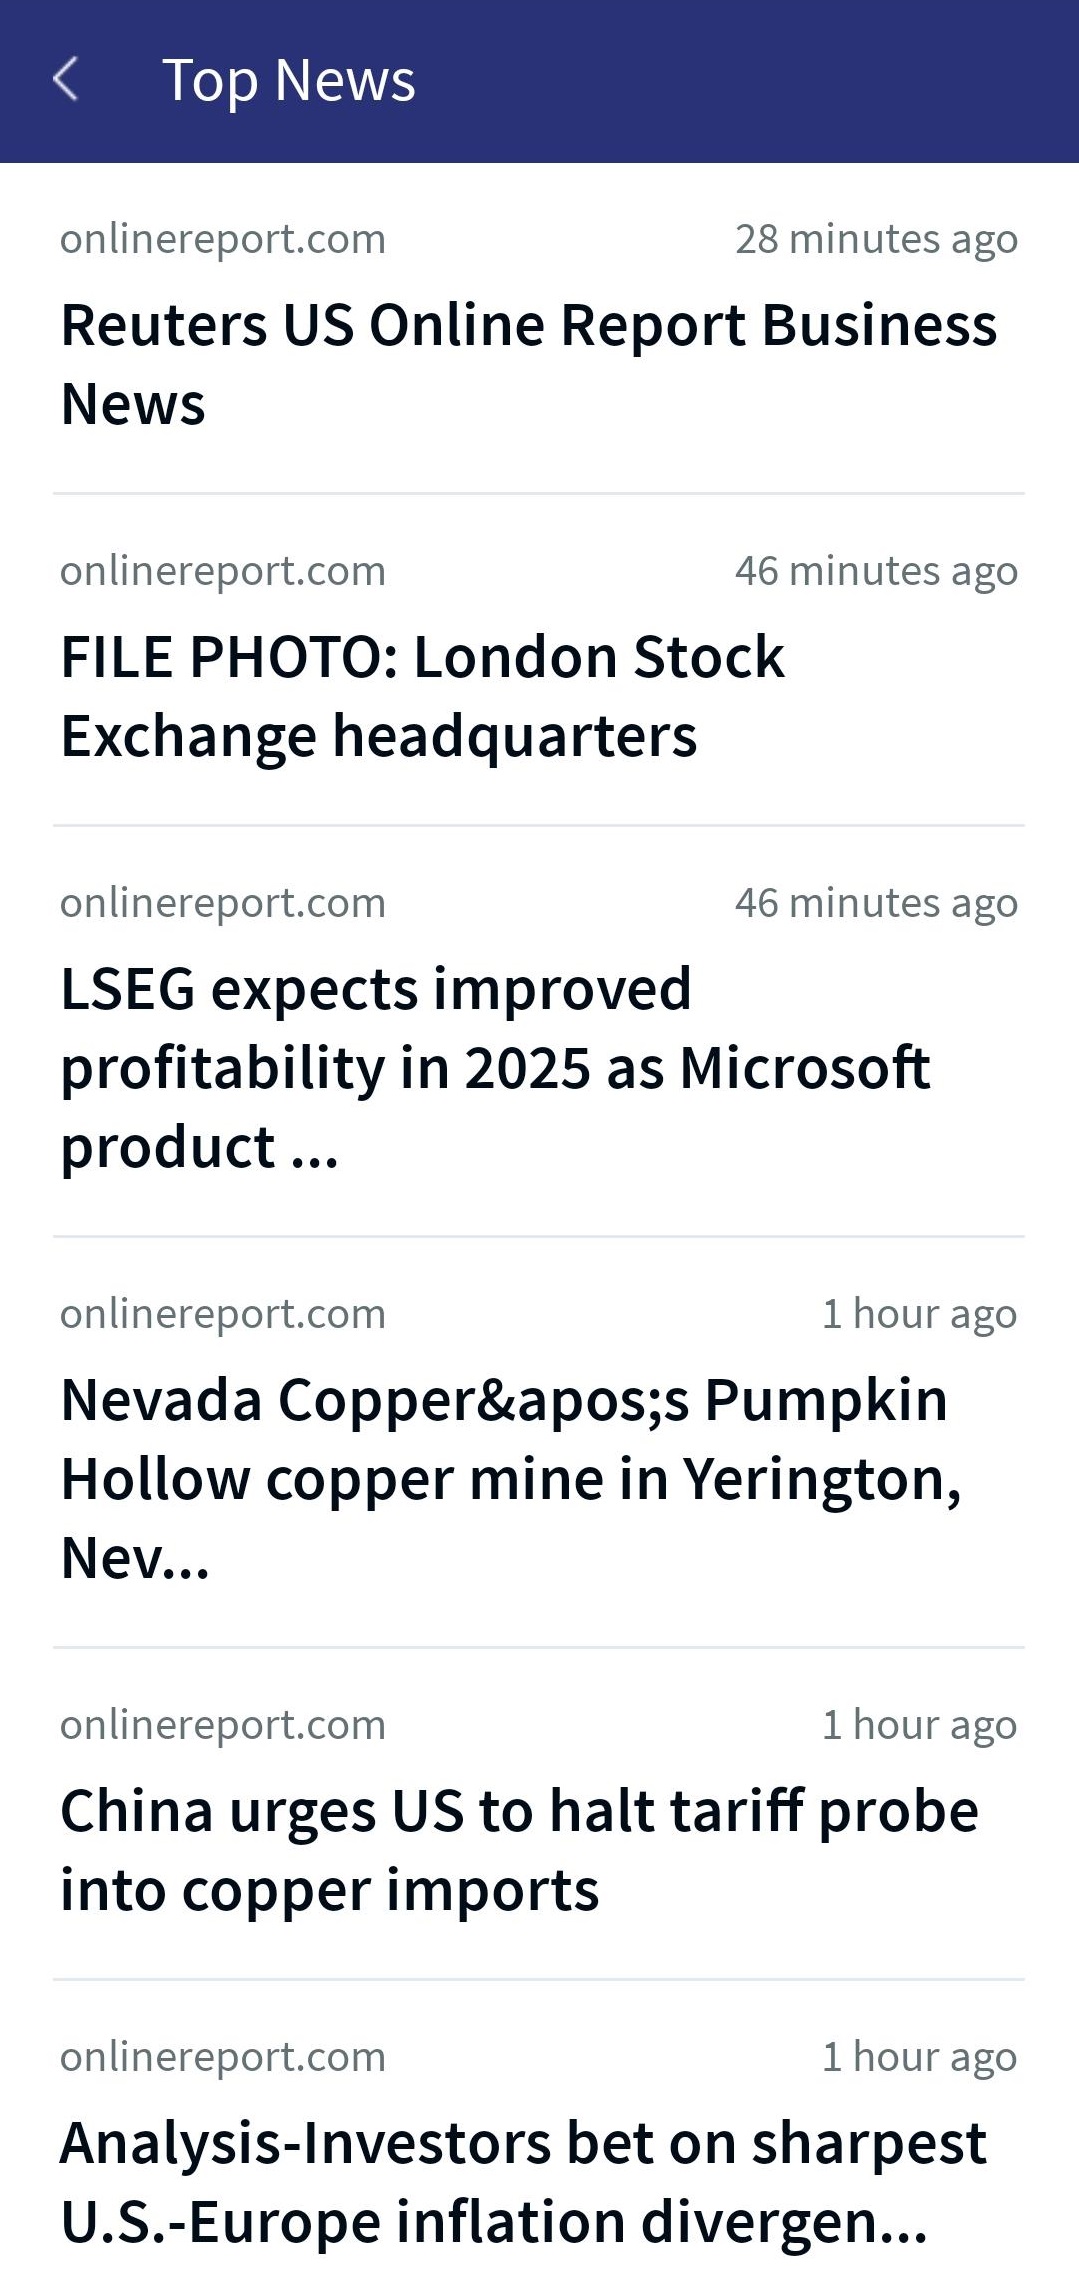
Top News List
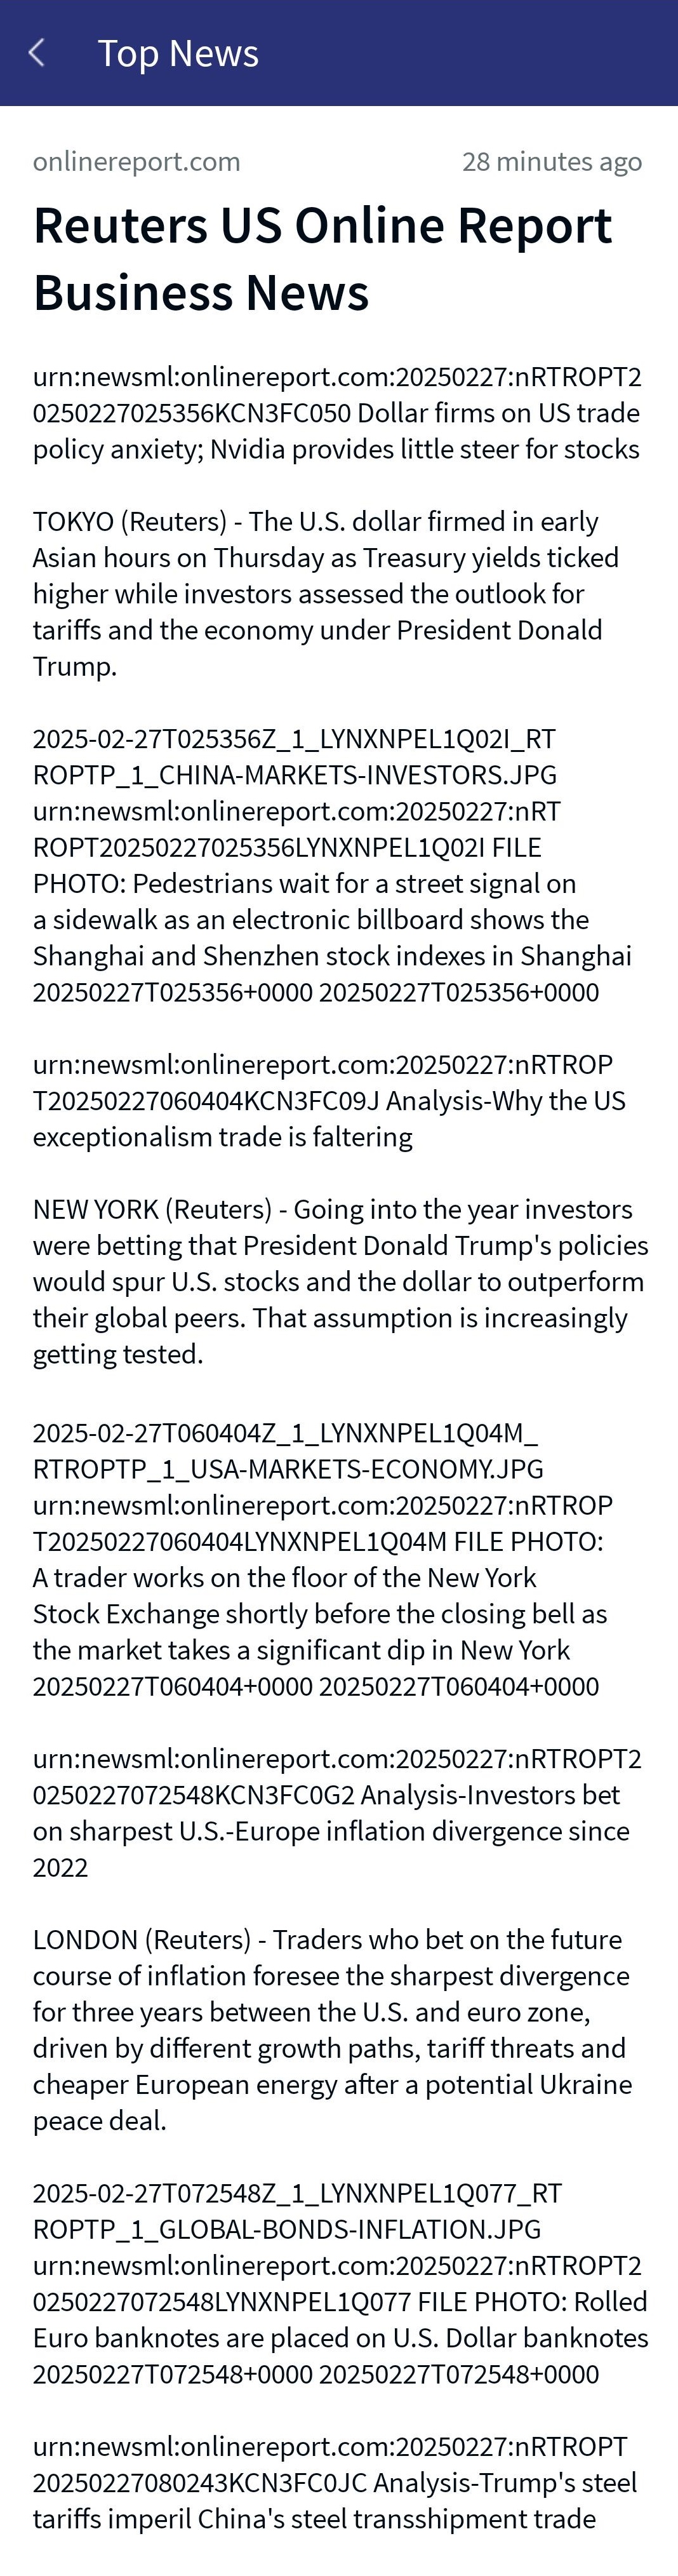
Top News - Detailed News
Watchlist
Online Banking: The Watchlist feature displays a list of instruments that you marked as favorite. With the Watchlist, you can quickly view the details of your favorite instruments from the Dashboard.
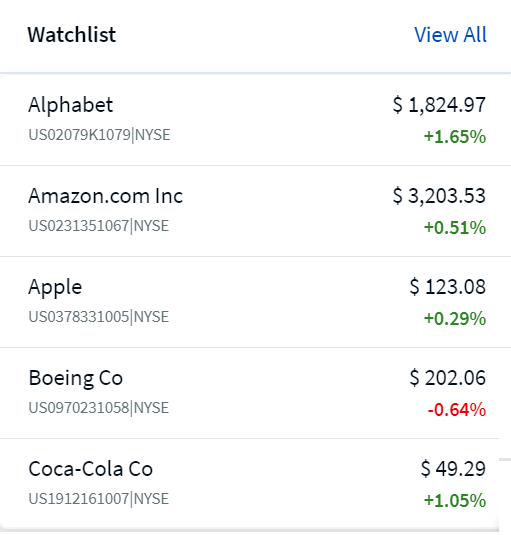
When you click View All, the Watchlist Instrument section appears.
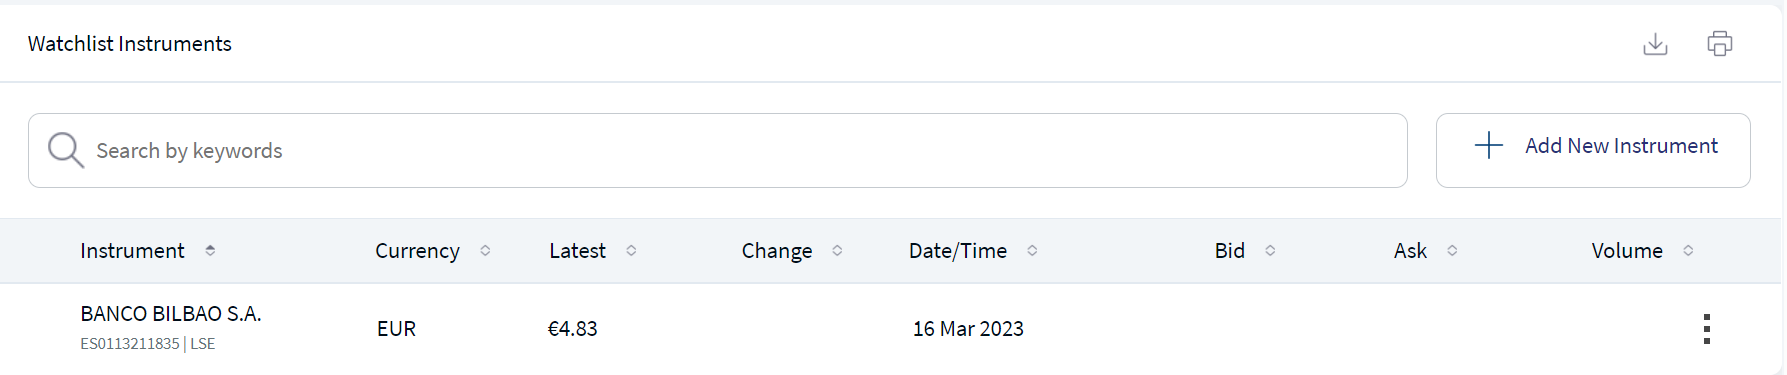
It displays the list of instruments that are added to the watchlist along with the following details:
- Instrument: Specifies the name of the instrument.
- Currency: Specifies the reference currency of the instrument.
- Latest: Specifies the latest price of the instrument.
- Change: Specifies the date and time at which the instrument price changed. The price change can be either positive or negative. The price change is also displayed in terms of percentage.
- Date/Time: Specifies the date and time at which the instrument price changed.
- Bid: Specifies the best available price to buy the instrument.
- Ask: Specifies the best available price to sell the instrument.
- Volume: Specifies the total volume of both buy and sell.
- Unrealized P&L: Specifies the difference between the current market value and the weighted average cost of the buy. Profit is displayed in Green and the loss is displayed in Red.
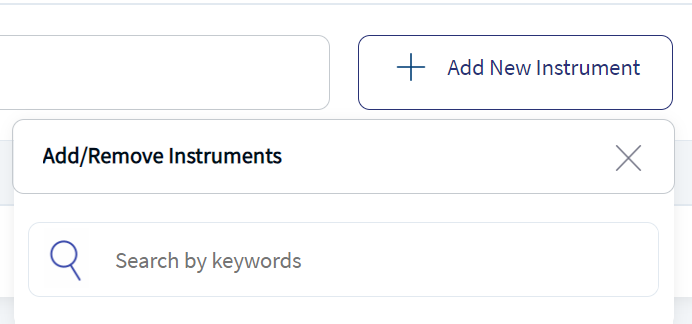
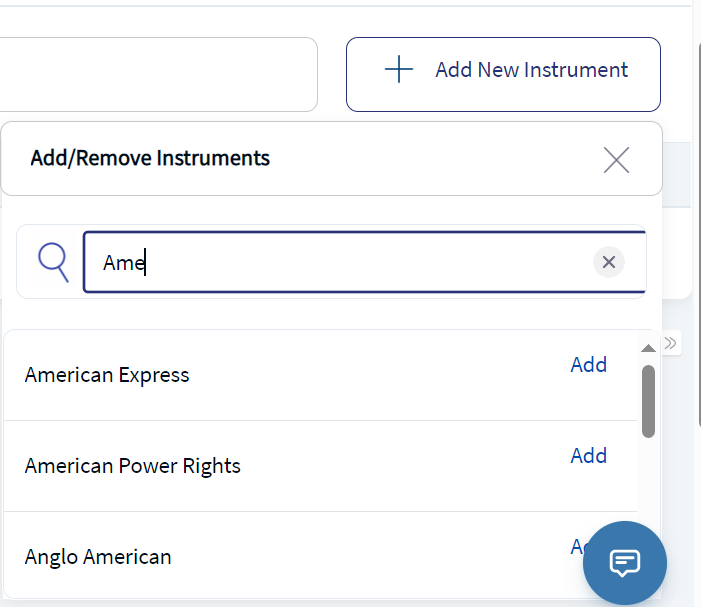
- Add New Instrument : This option lets you to add a new instrument to the watchlist. To do so, click on Add New Instrument. Add/Remove Instruments pop-up window appears. Enter the instrument name in the Search field and press Enter. The instrument list matching the entered criteria appears. Select the instrument and click Add. The selected instrument appears in the watchlist list.
- Search :You can search for a specific instrument using the Search field.
- Download :This option lets you download the instrument list using the download icon. Click the download icon, and a PDF file with all the details is downloaded to your local system.
- Print : This option lets you print the watchlist instruments using the Print icon. Click the Print icon, and the Print window appears.
You can also delete the instrument from the watchlist by clicking on the Remove option. This option is displayed in the search field if the instrument is already added to the watchlist.
The data for Latest, Change, Bid, Ask, Volume, and Date/Time is updated by the Market Data Provider:
You can perform the following actions on the Watchlist page:
- View: From the Contextual Menu of the desired instrument and select View. The respective instrument page opens.
- Buy: From the Contextual Menu of the desired instrument and select Buy. The Place a New Order screen appears. For more information about how to place an order, click here.
- Sell: From the Contextual Menu of the desired instrument and select Sell. The Place a New Order screen appears. For more information about how to place an order, click here.
- Delete: From the Contextual Menu of the desired instrument and select Delete. The instrument is deleted from the Watchlist list.
Mobile Native App:Watchlist is the feature available in the footer menu. When you click on it, the system navigates the user to the Watchlist screen, where the user can find a list of instruments marked as favorite. Search for an instrument in the Add/Remove Instruments field to view the list of instruments matching the entered criteria.
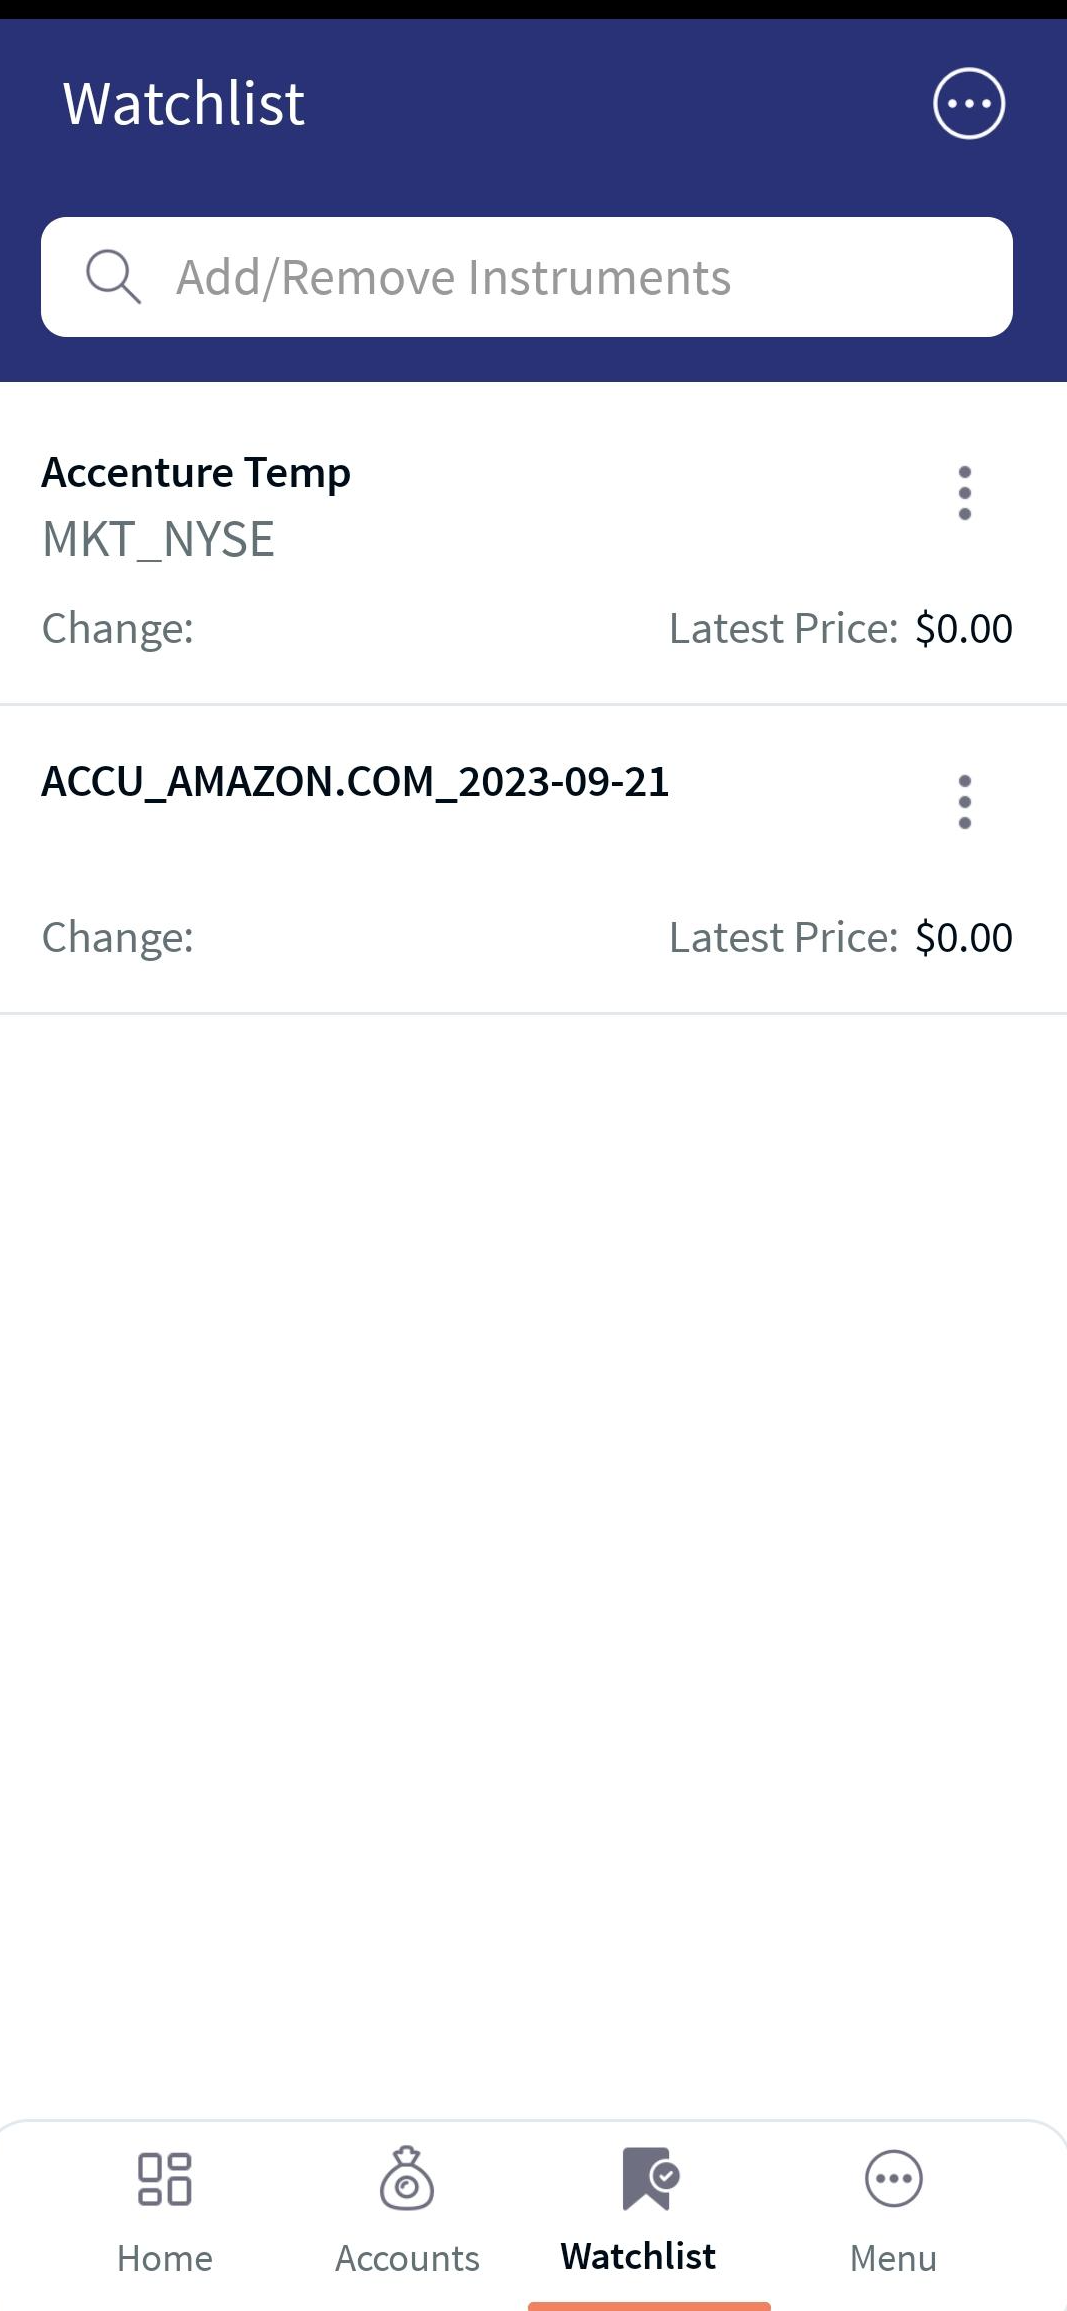
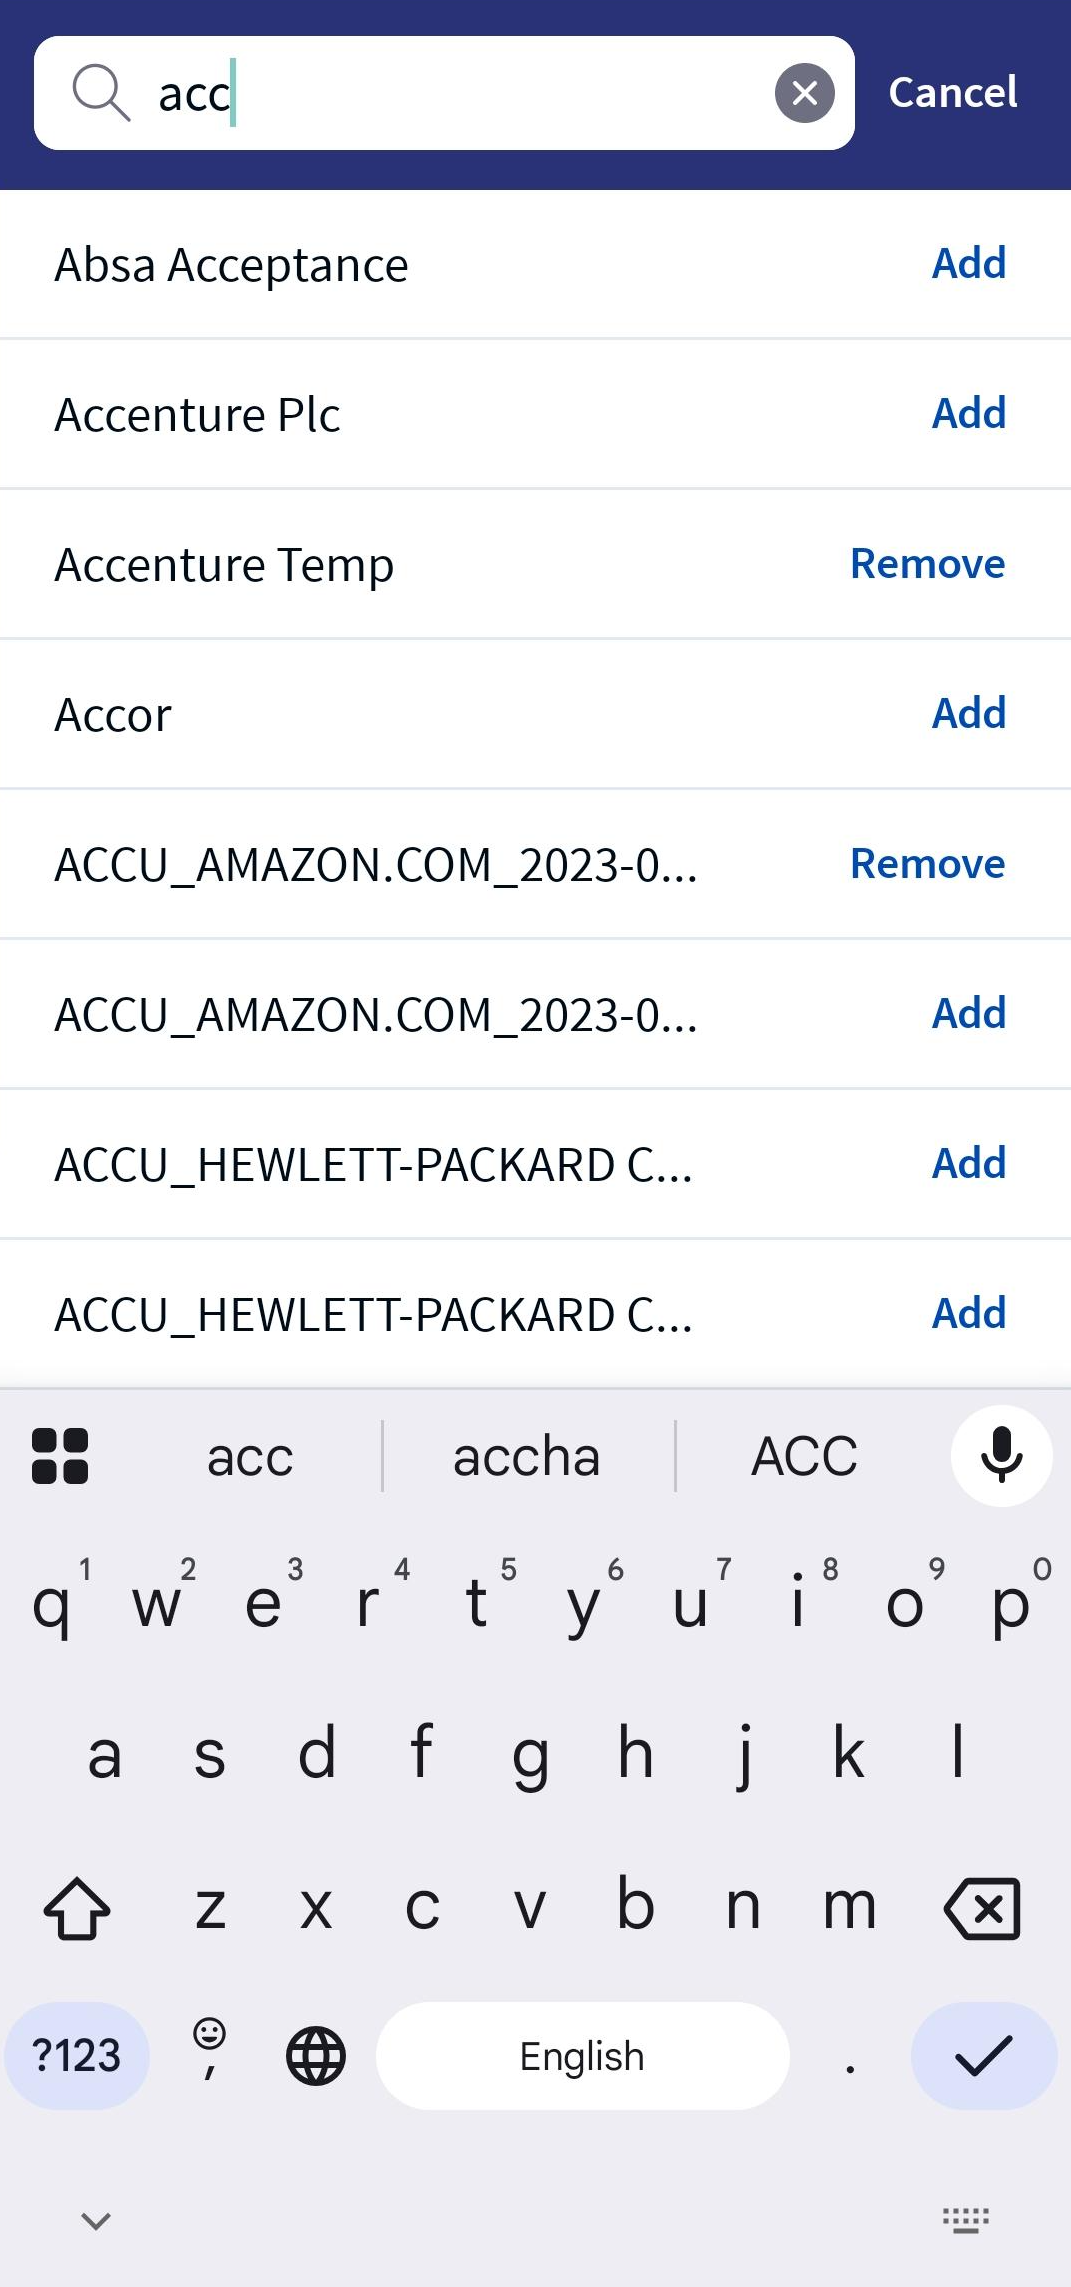
Click Add to add the instrument to the watchlist. Select any instrument, and click the contextual menu to perform any of the actions.
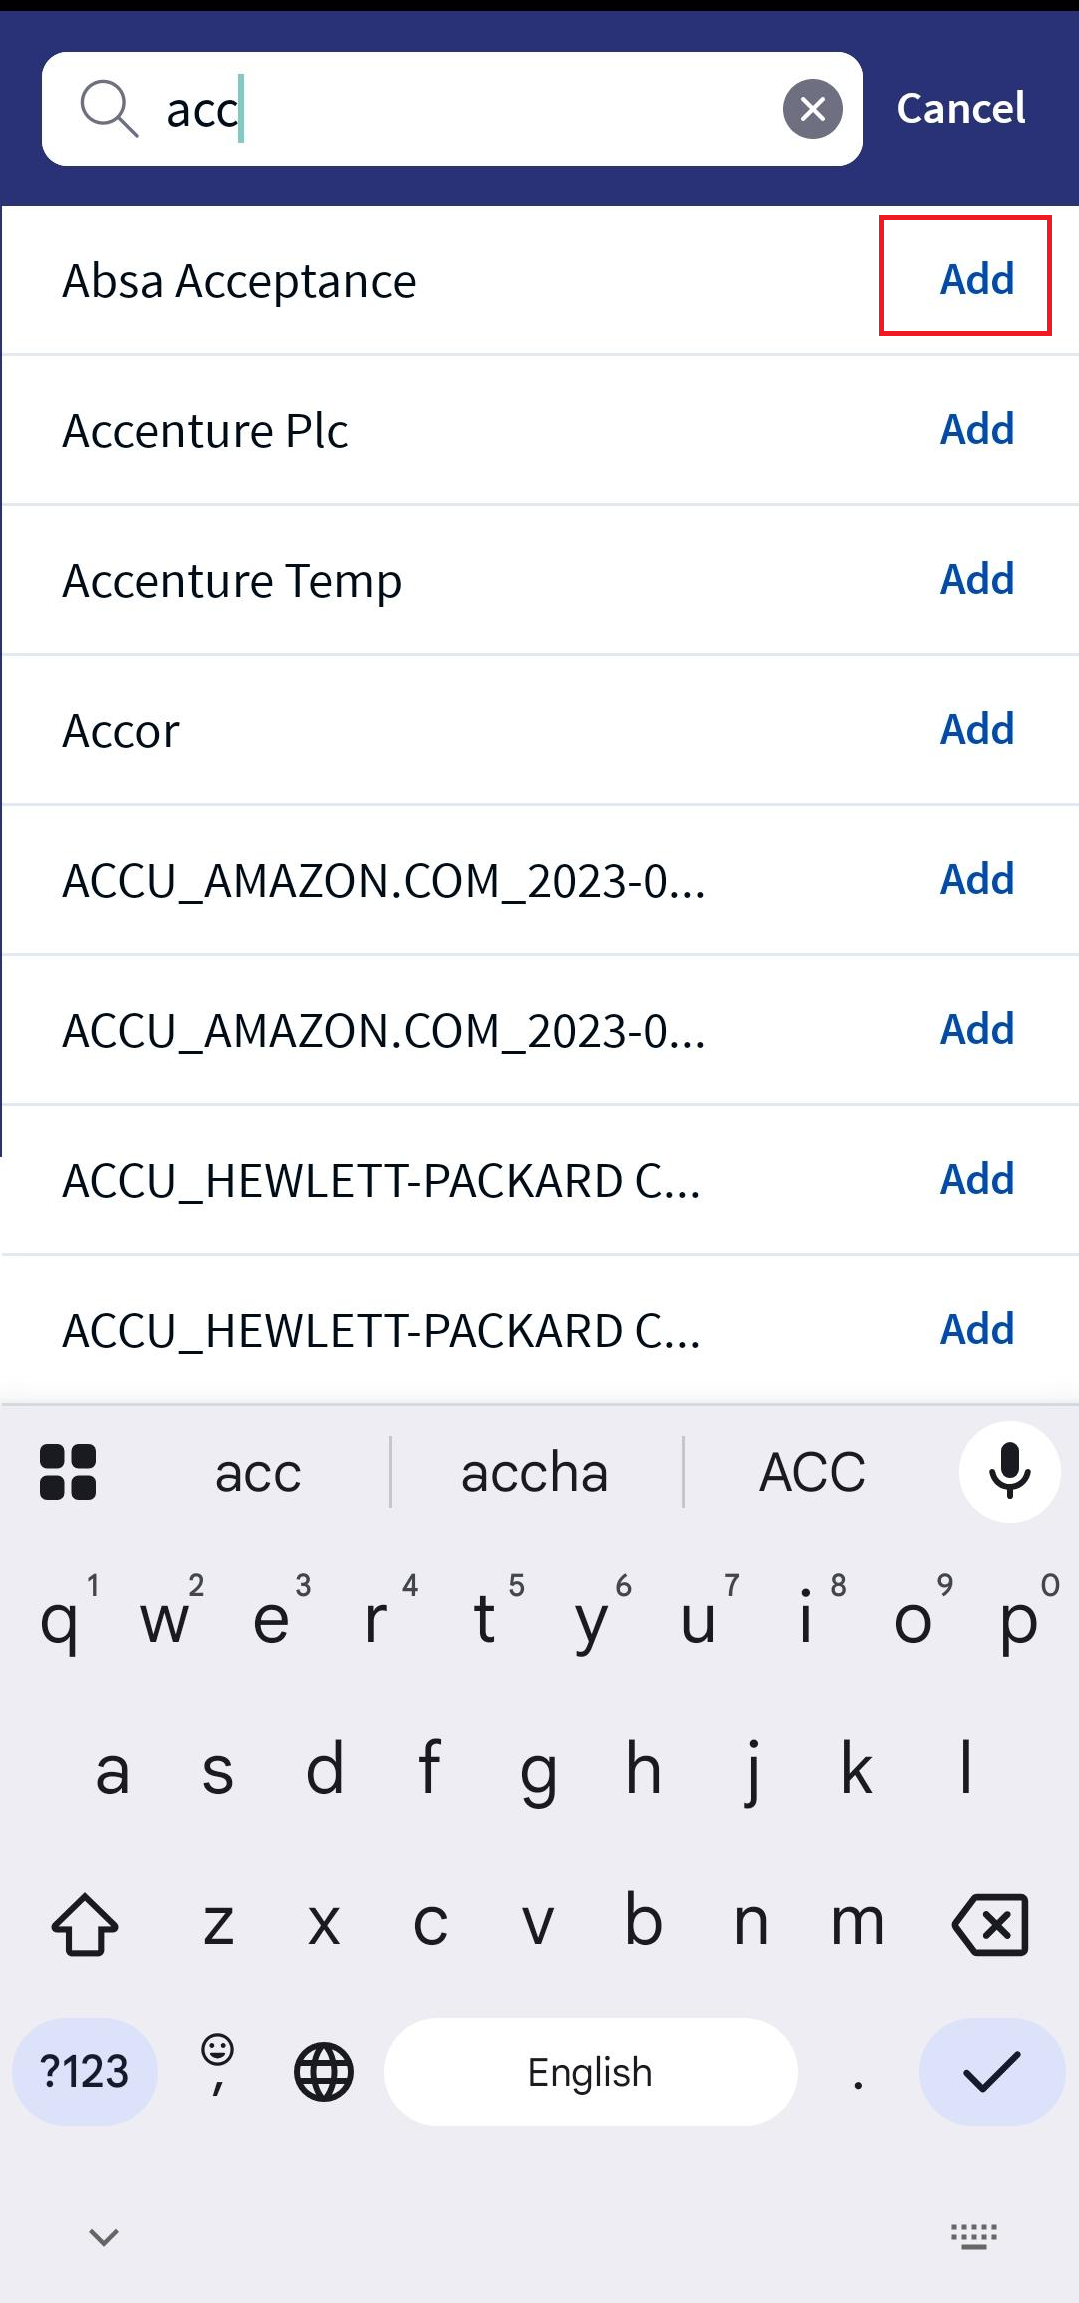
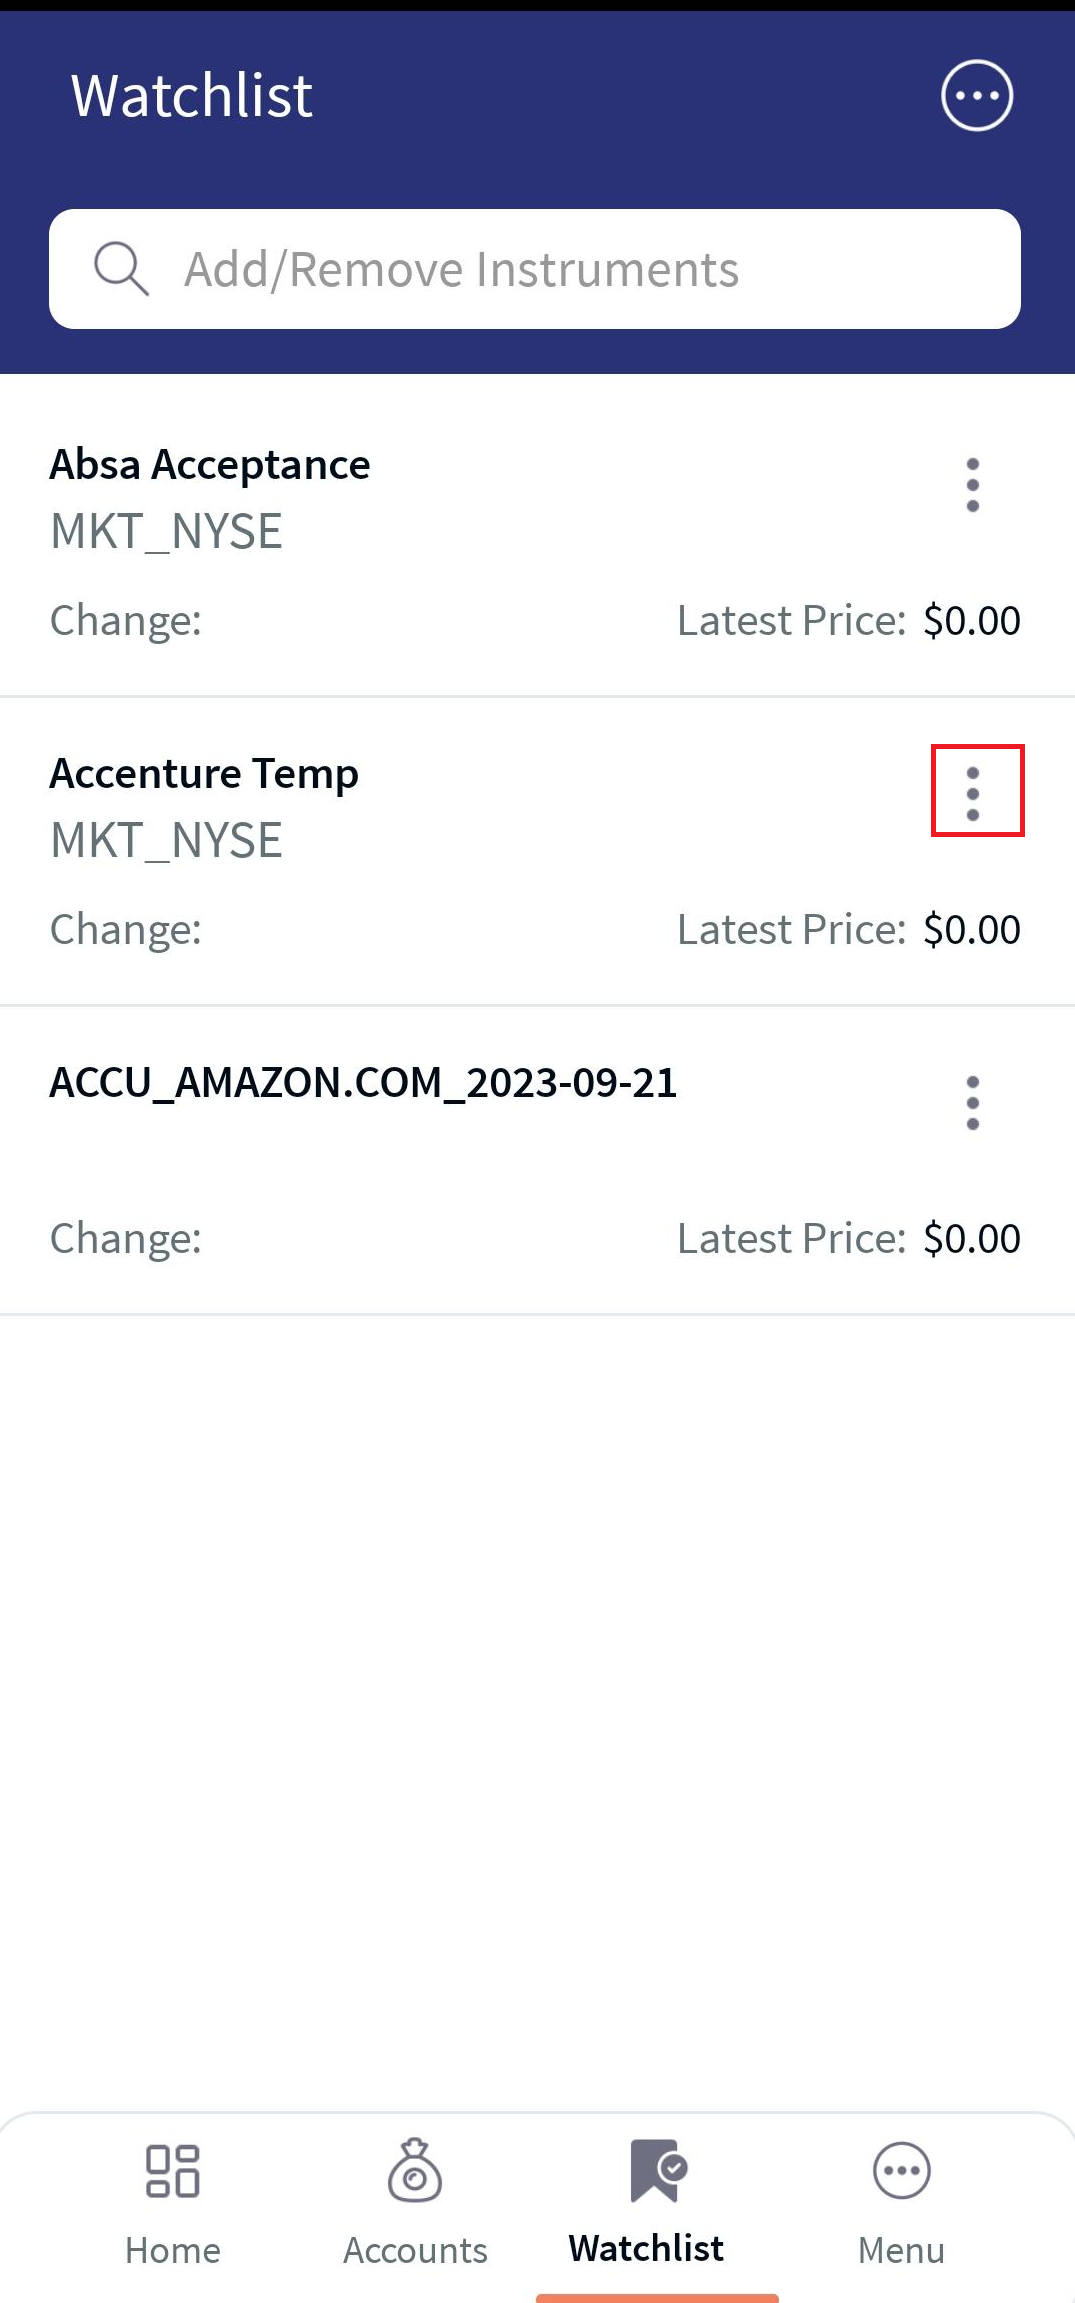
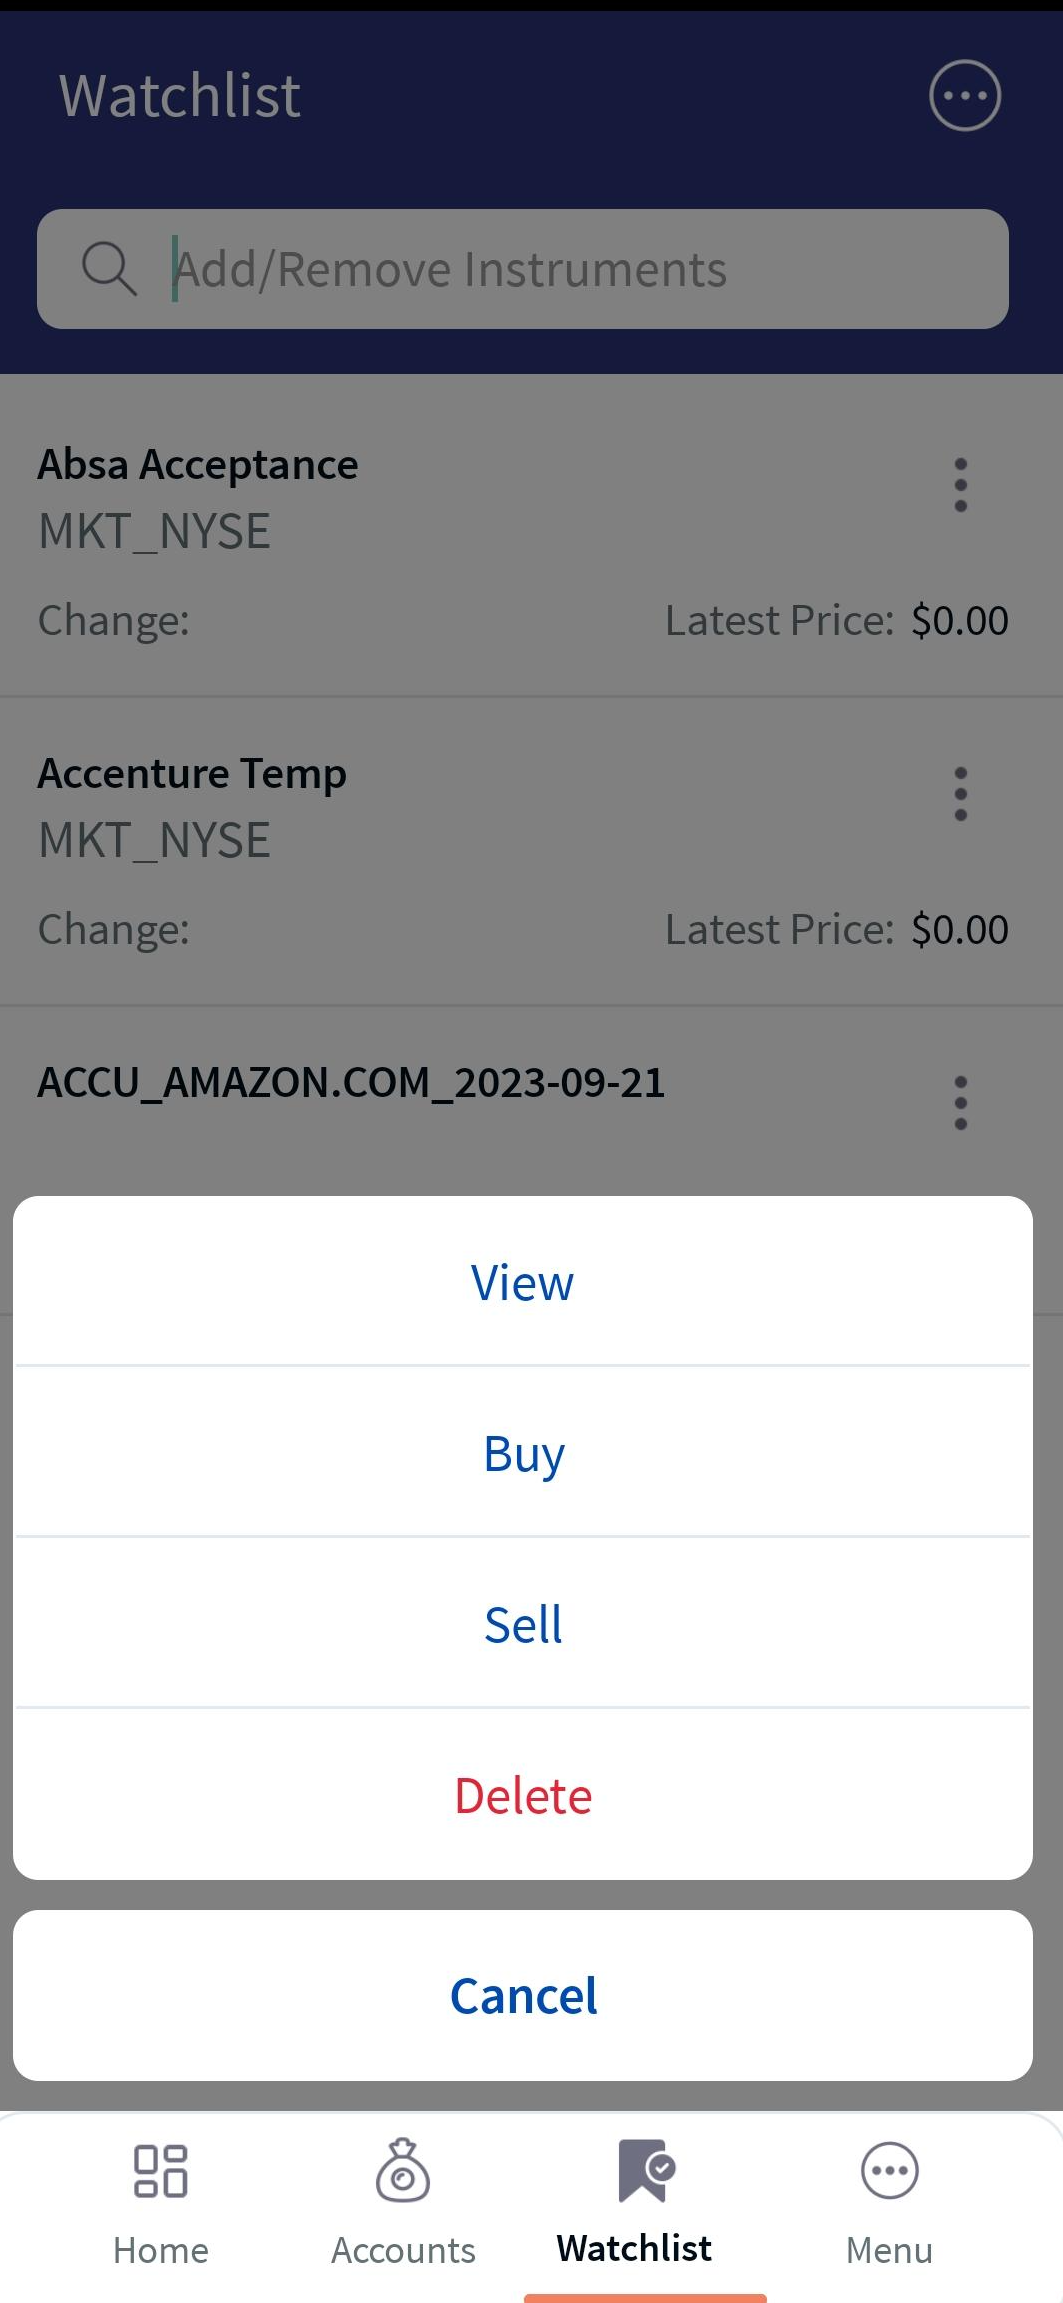
For a detailed description of the contextual menu functionalities such as View, Buy, Sell, Delete, and Cancel, refer to the above Online Banking section.
In addition, you can perform the below actions when you click on  icon, present at the top-right corner of the screen.
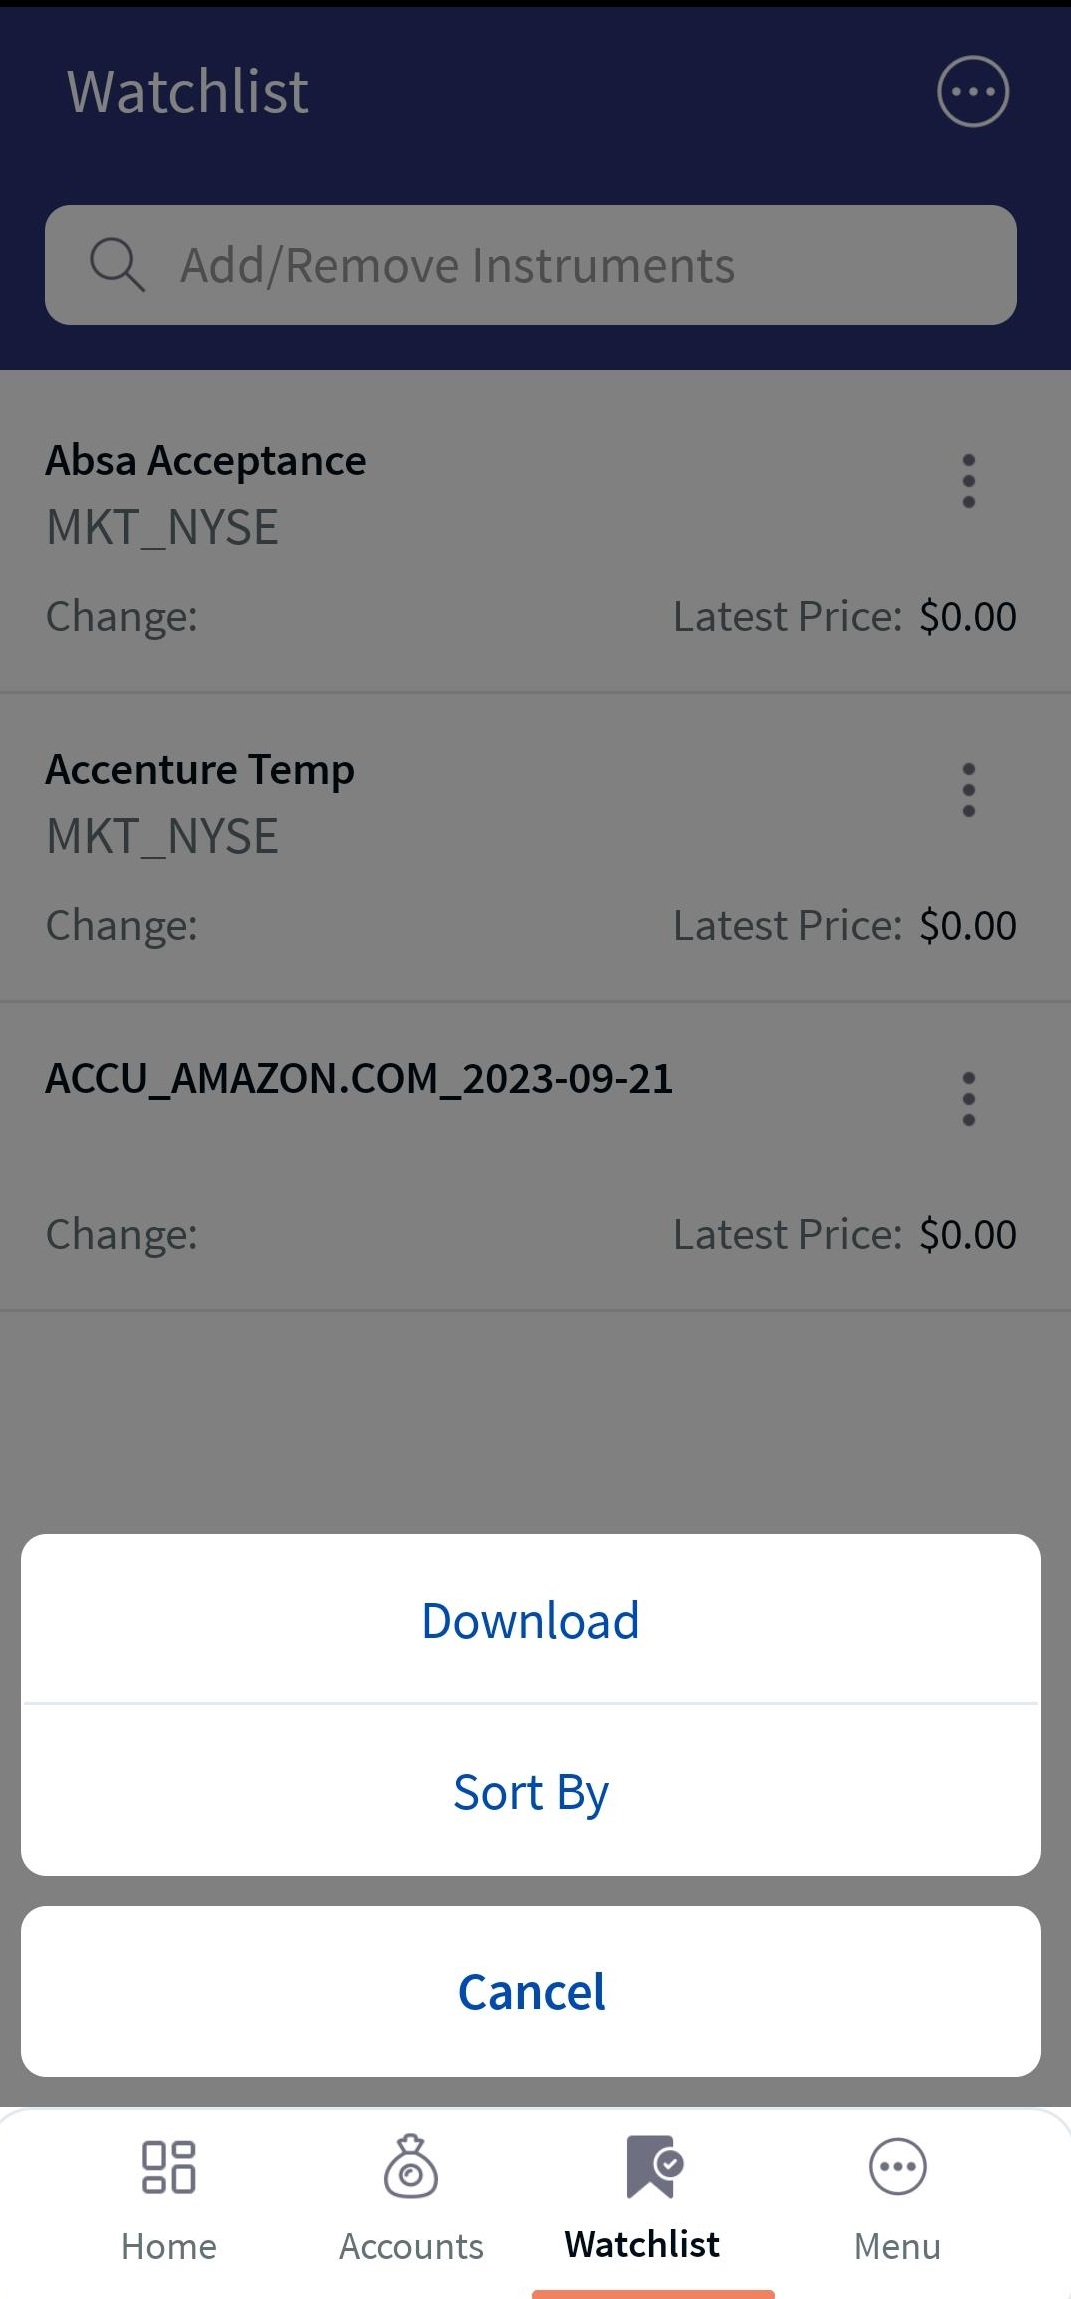
- Download - Click the download option, and a PDF file with all the details is downloaded.
- Sort By- Click Sort By option to sort the instruments as per the desired parameter.
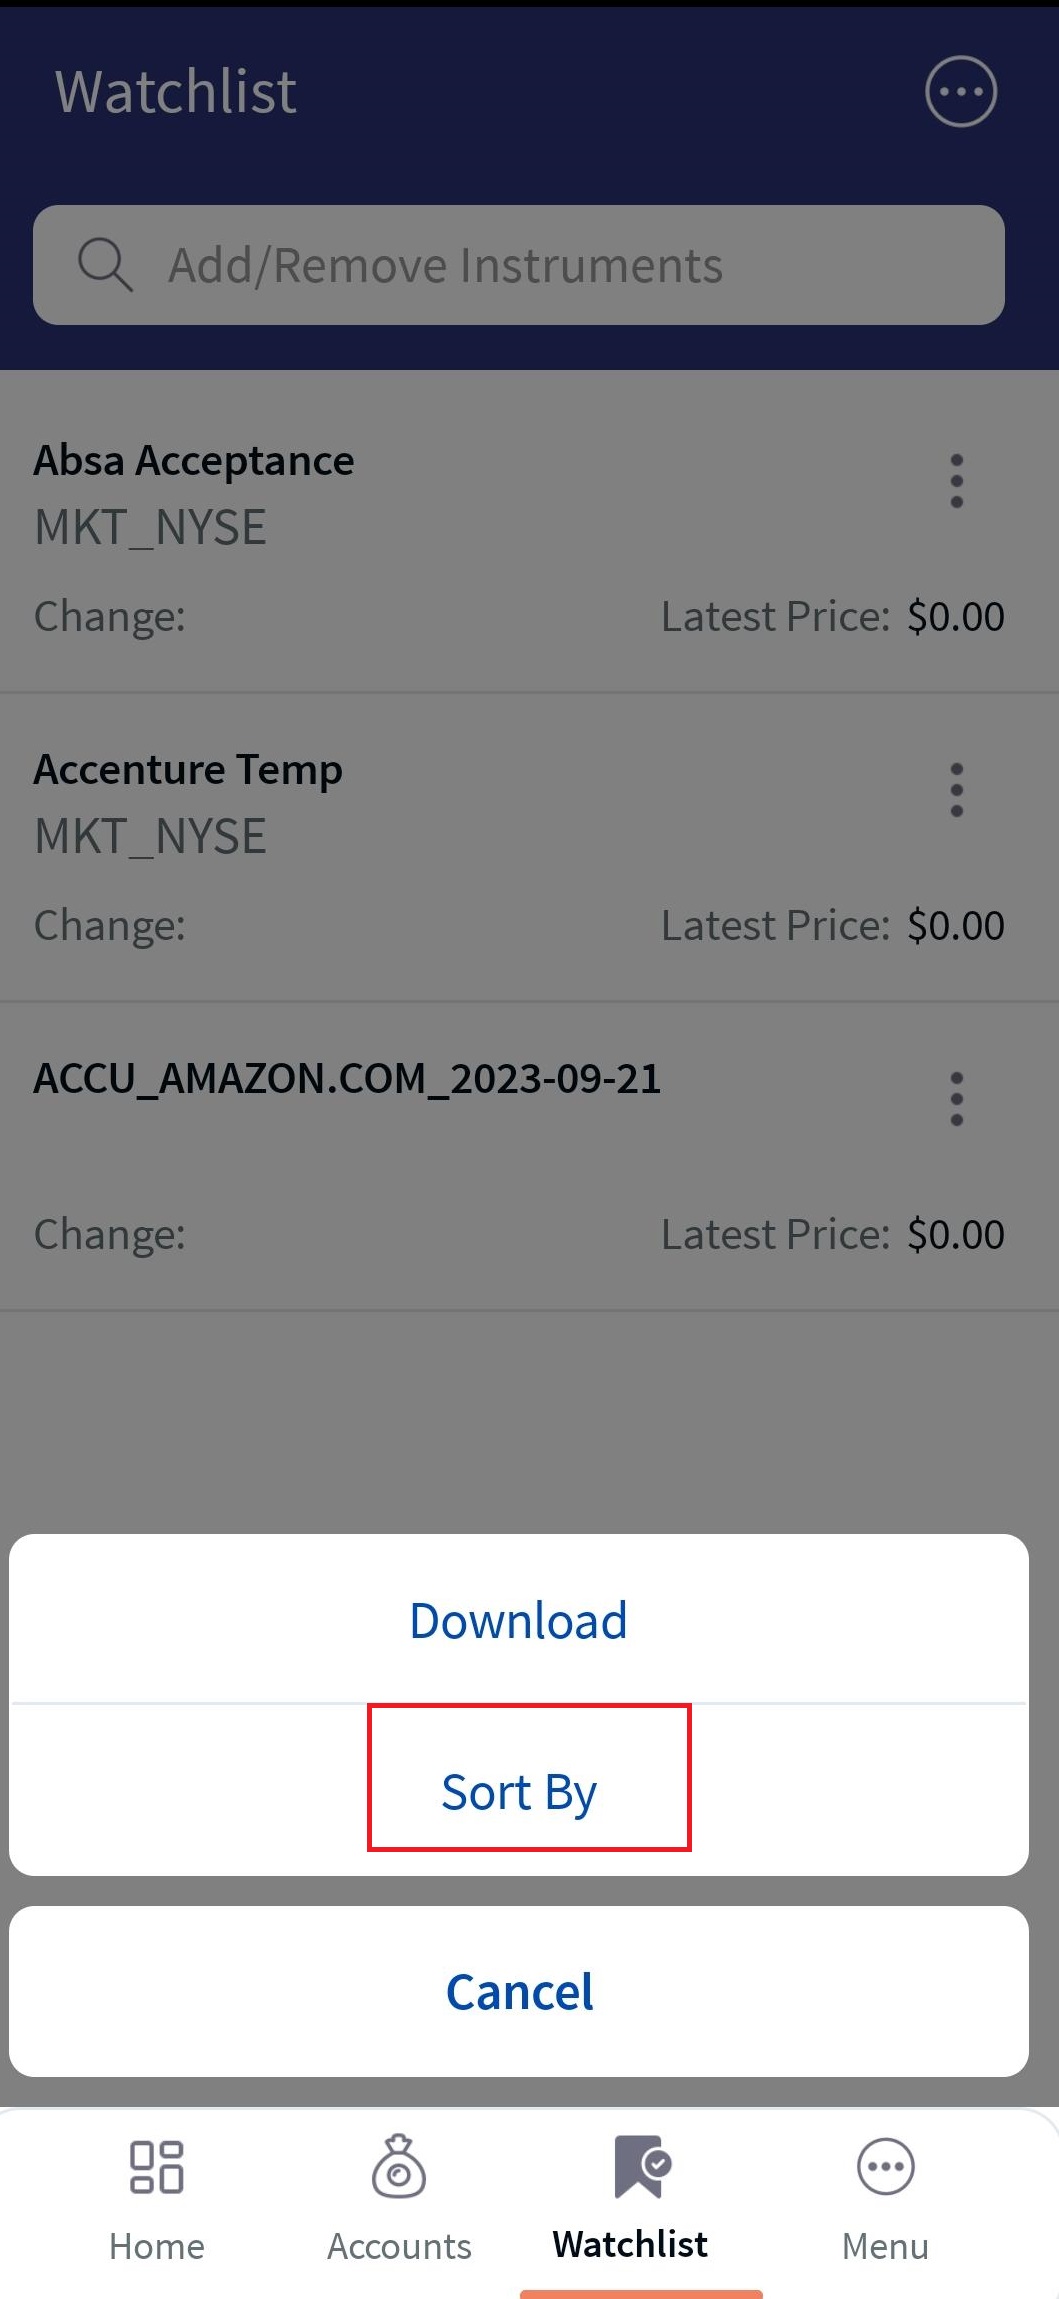
Sort By
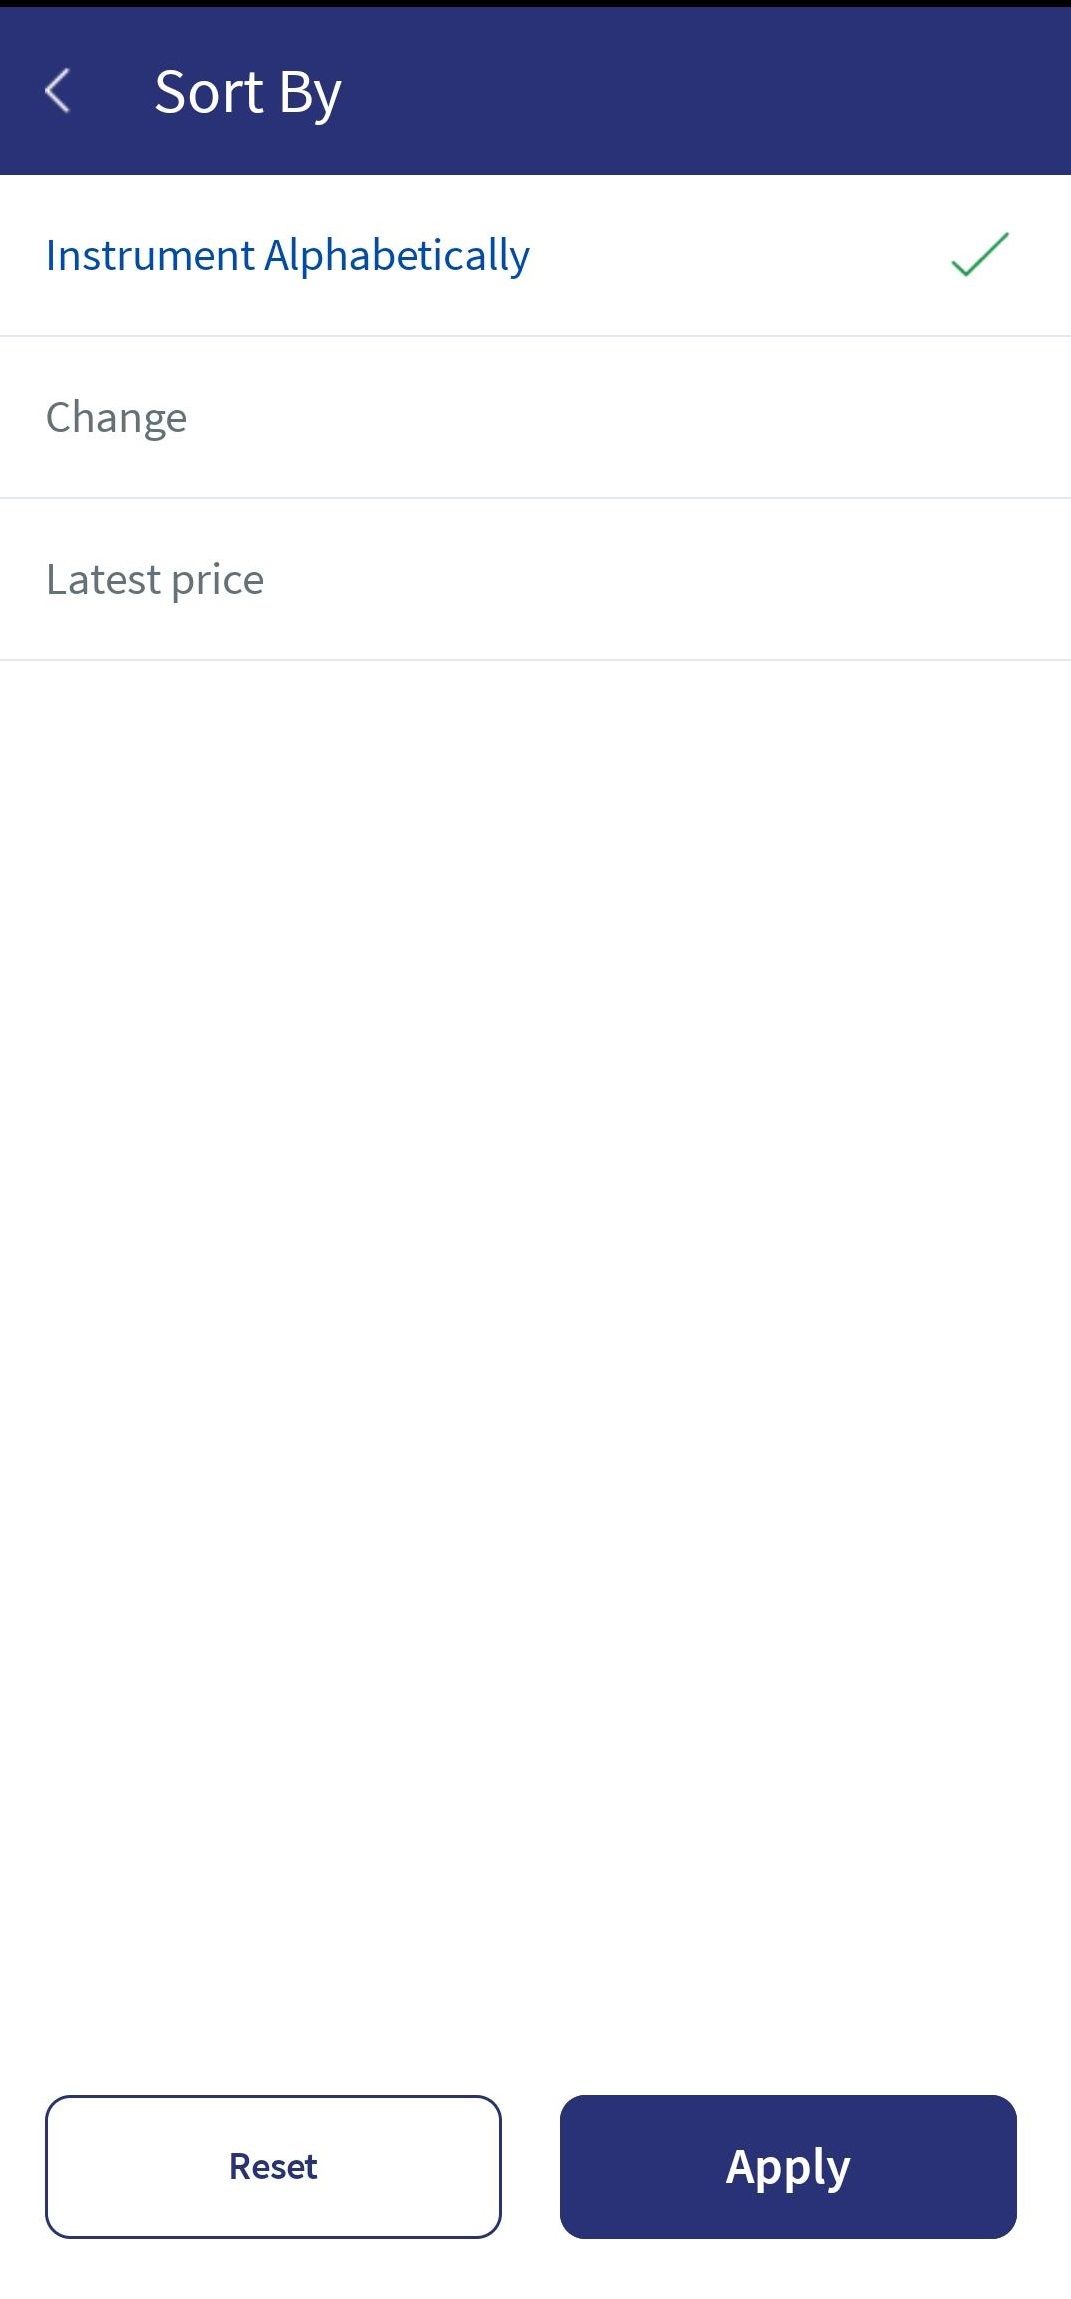
Sort By Options
- Cancel- Click cancel to cancel the action.
Business Process Diagram - Watchlist
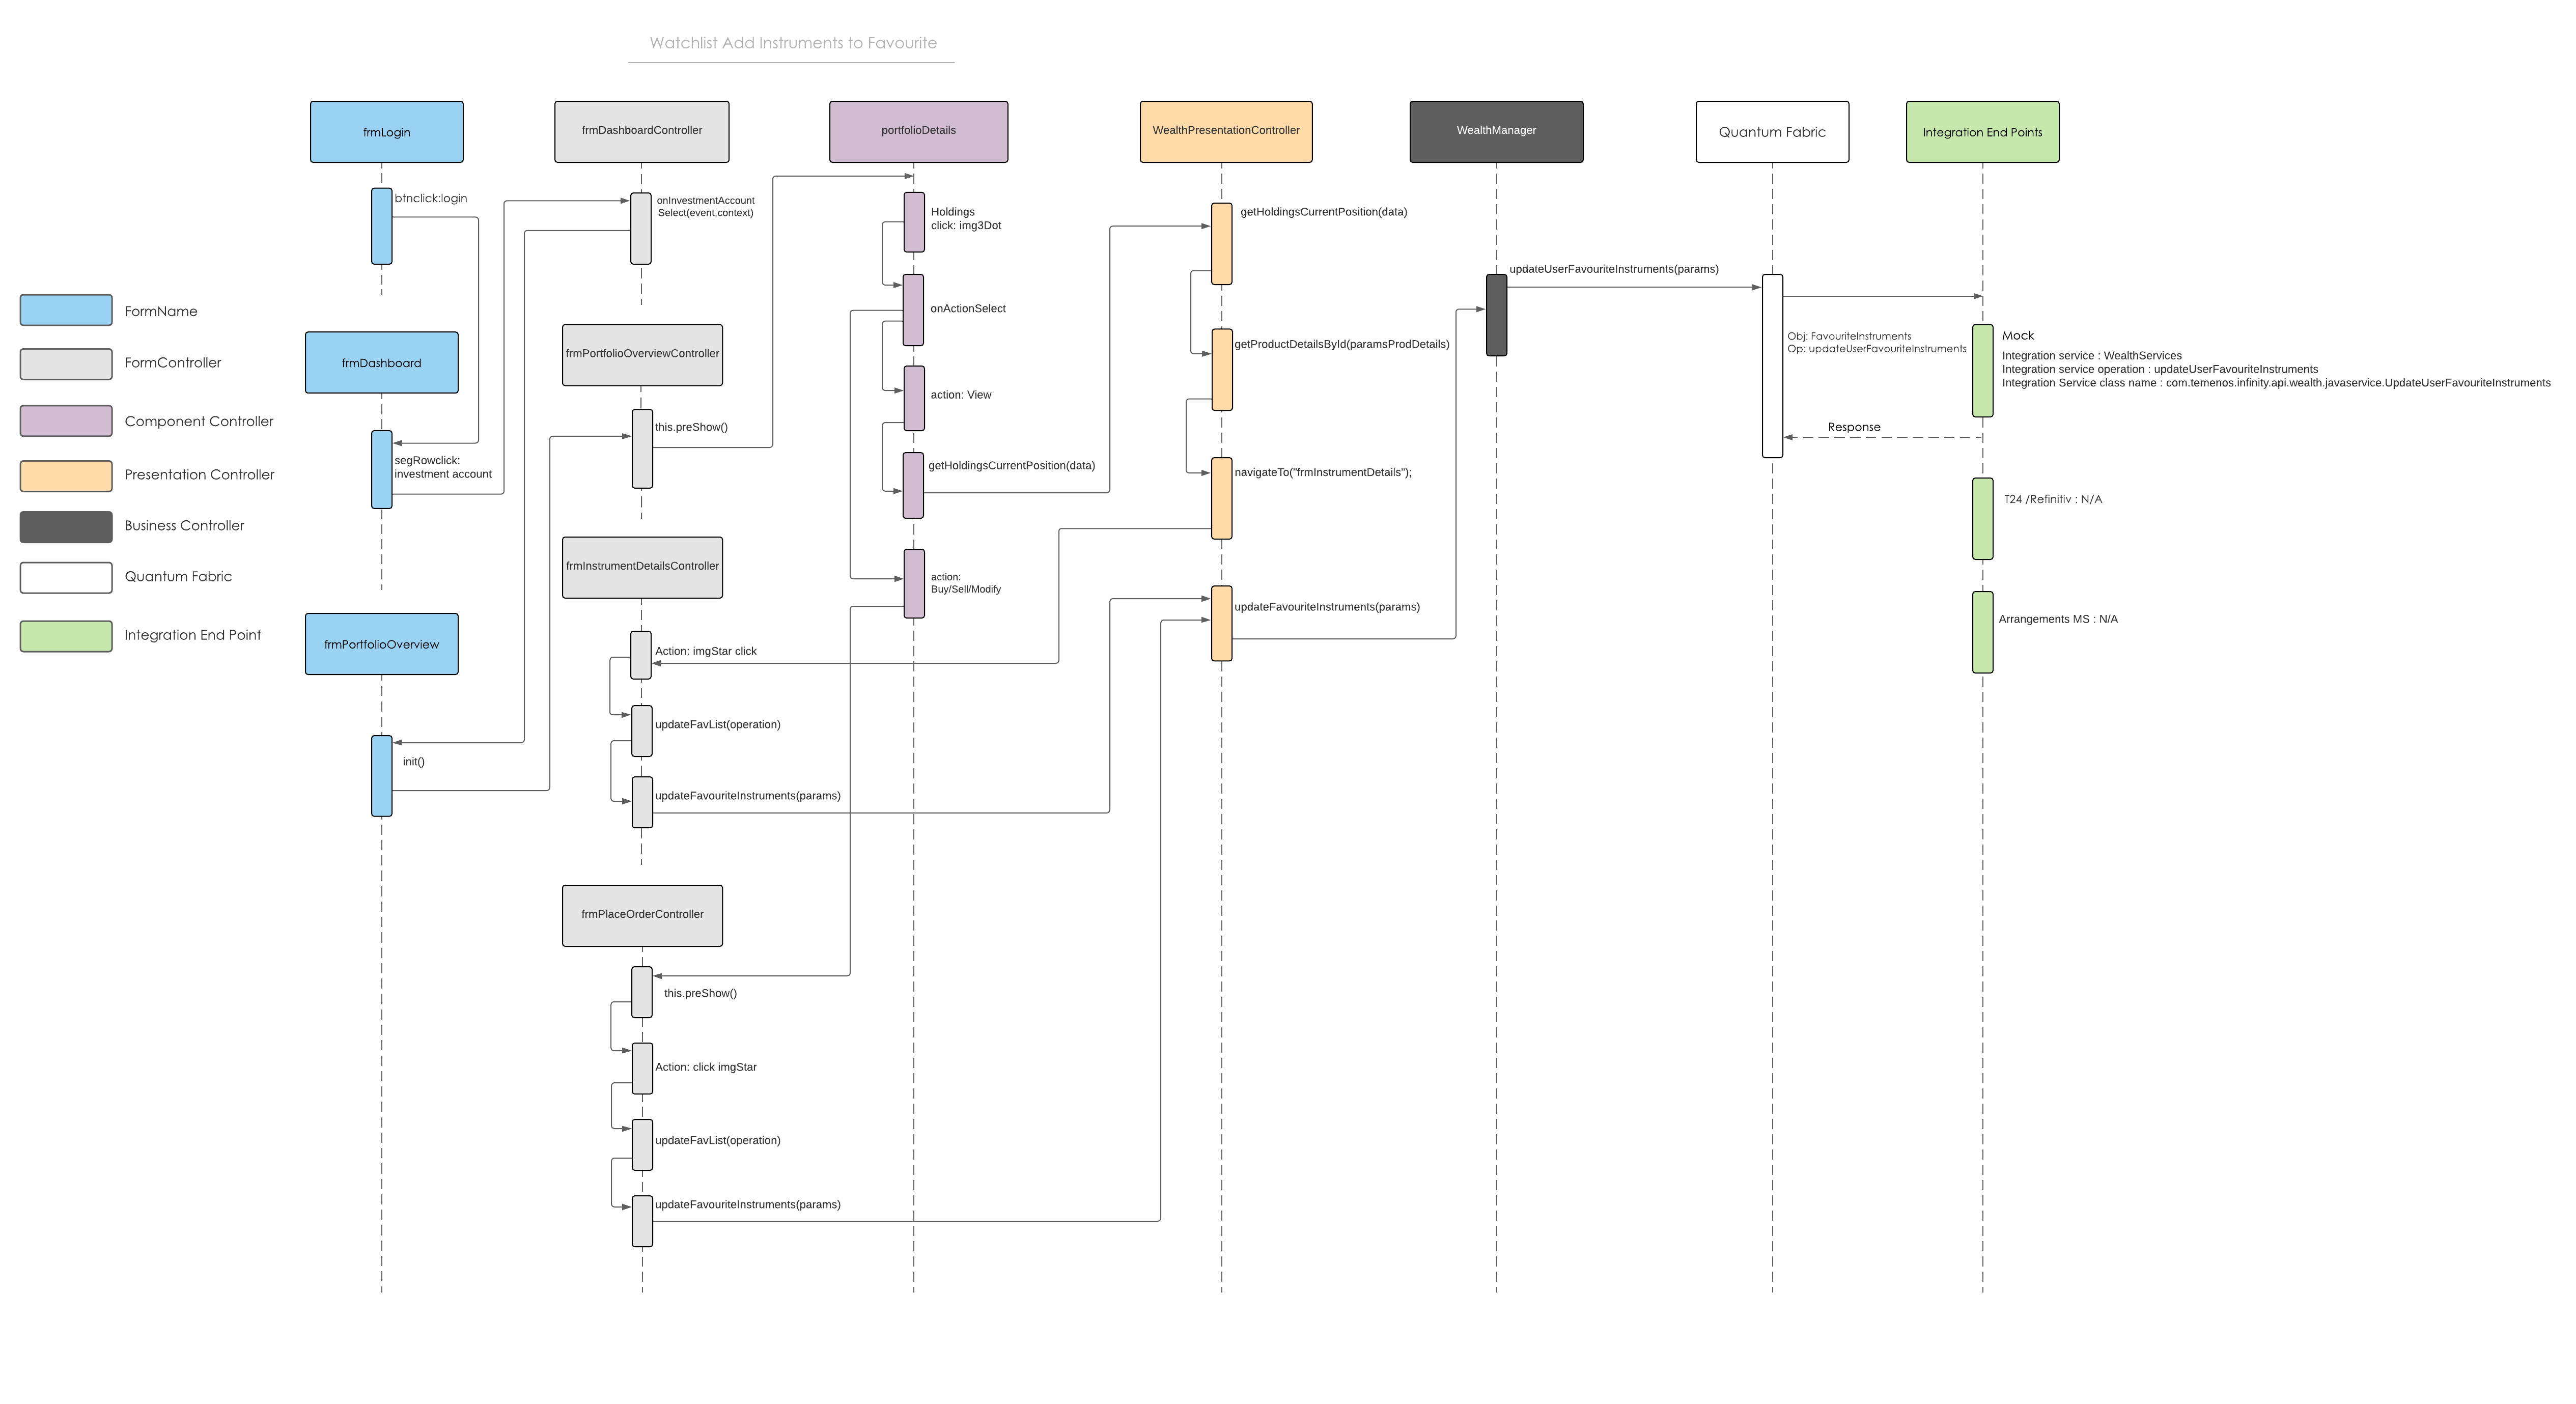
Sequence Diagram - Watchlist
Recent Activity
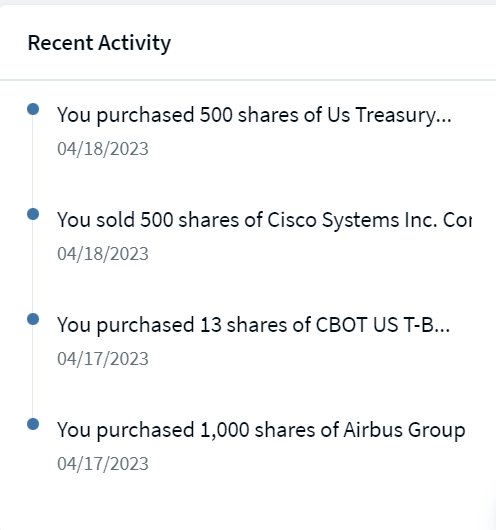
Online Banking: The Recent Activity section displays the recent history of your investment accounts. It only displays the completed transactions that occurred recently.
Mobile Native App:The Recent Activity link is displayed when you click the Accounts icon. This link appears adjacent to the ‘My Investment Summary’ feature. On click, the list of recent activities screen gets displayed.
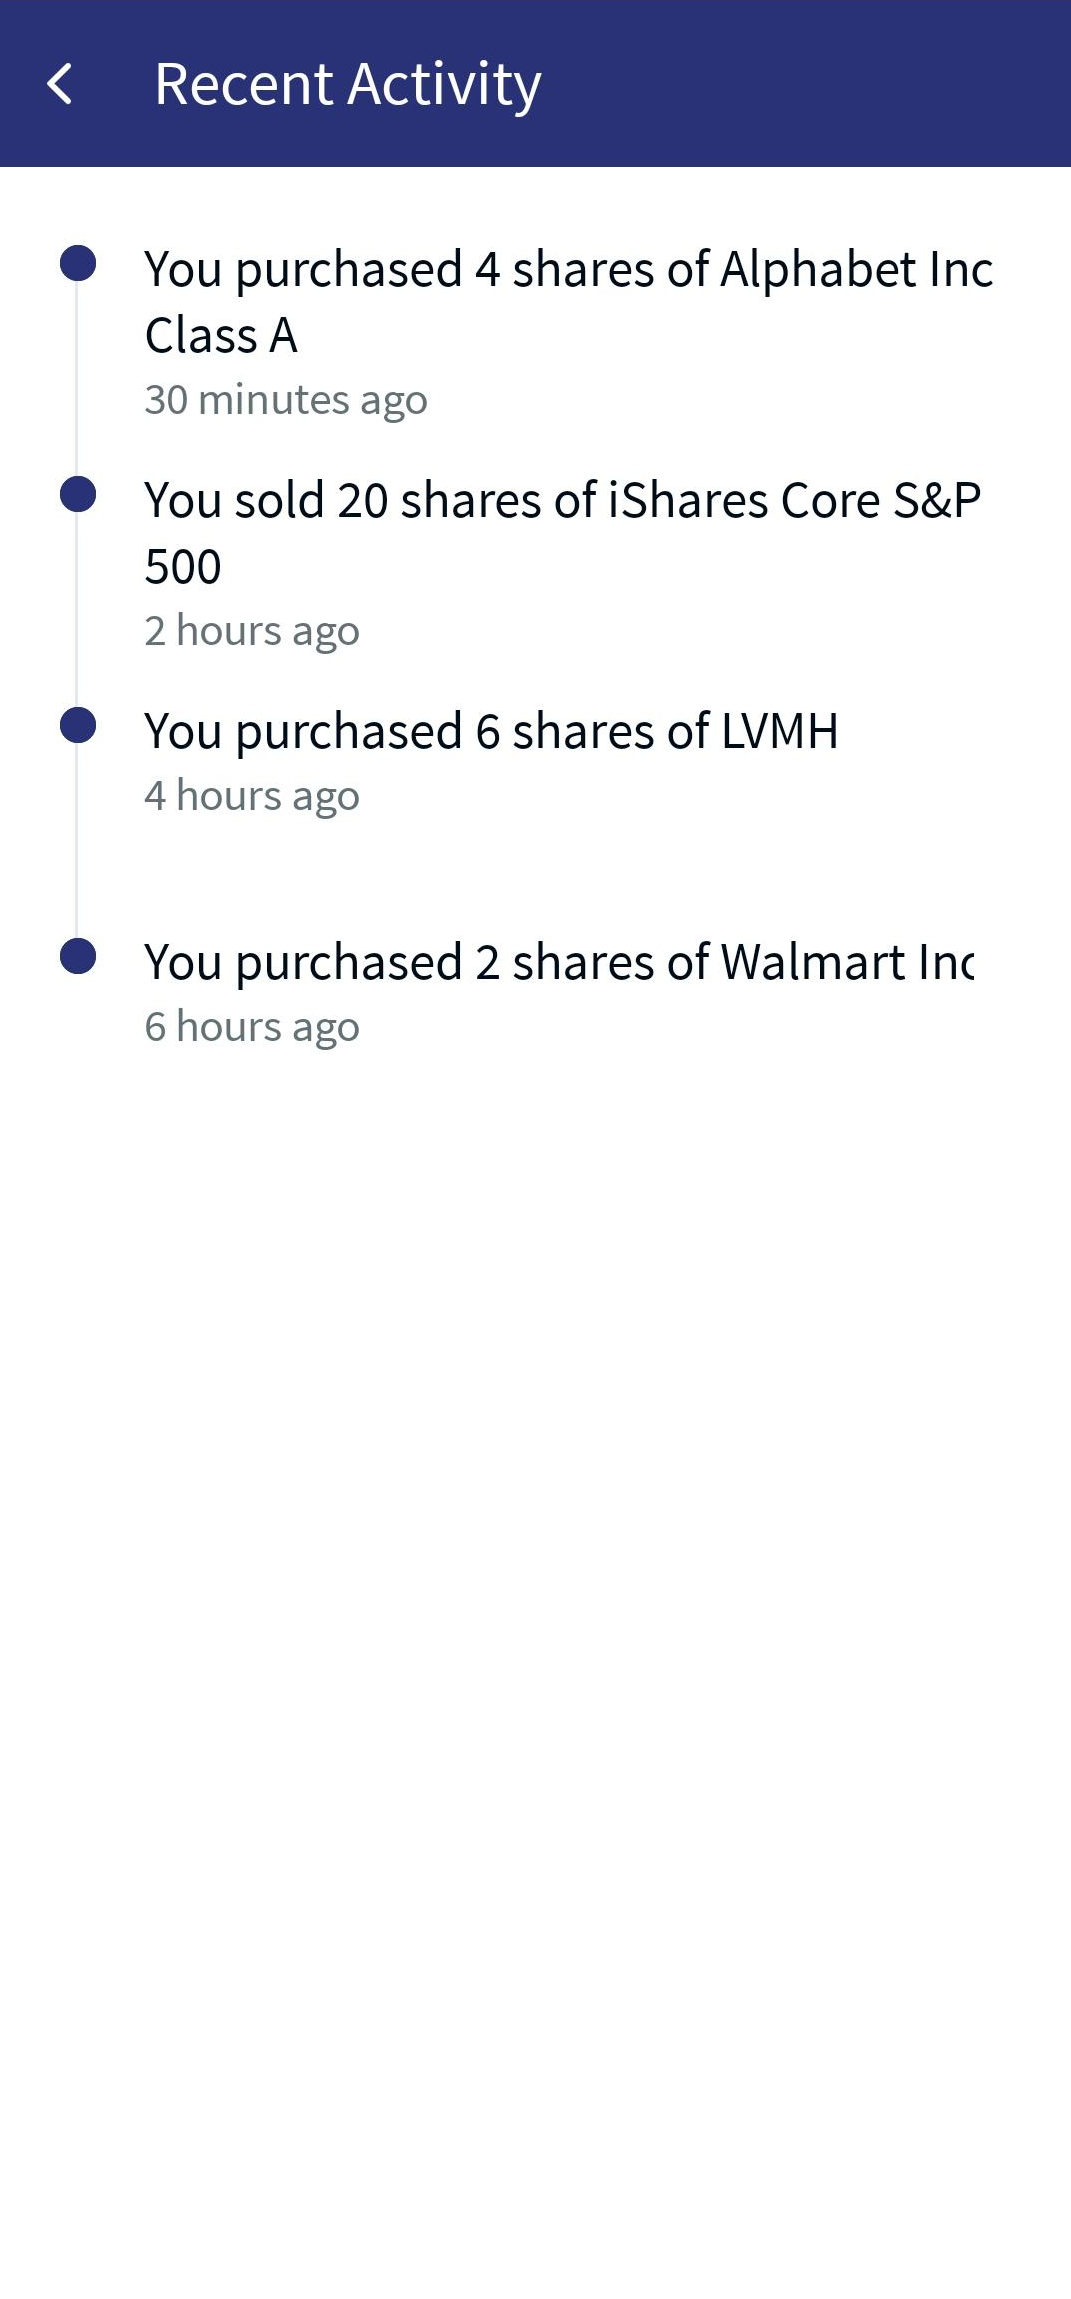
In addition, you can navigate back to the ‘My Investment Summary’ (My Accounts) screen when you click on the back arrow, which is in the top-left corner of the screen.
Personal Accounts
Online Banking: The Personal Accounts section displays your accounts, which are categorized into different types such as Savings Accounts, Checking Accounts, Credit Cards, and Loan Accounts. It lists down the account names along with the available balance.
It also displays the number of accounts in each category and the Total Available Balance of all the accounts as the. The Total Available Balance is displayed only if all the accounts are of the same currency.
You can select the type of accounts that must be displayed by selecting the desired option from the Showing drop-down list. To filter the type of accounts that are being displayed, click the Filter icon, select the desired options, and then click Apply.
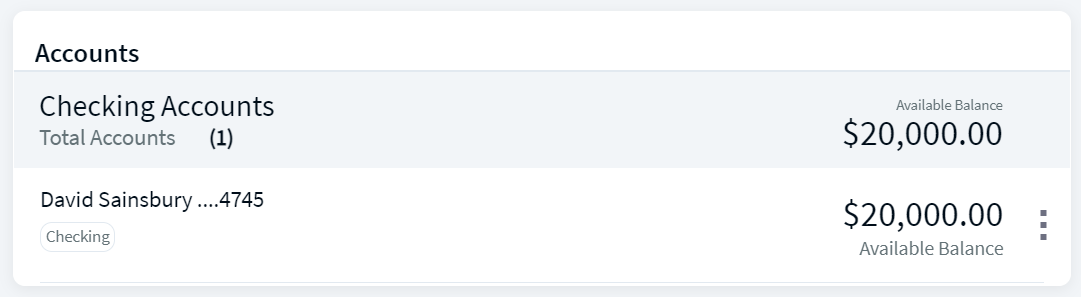
When you click a specific account, the account details screen appears that provides information about your account. For more information, refer to Account Details and Transactions.
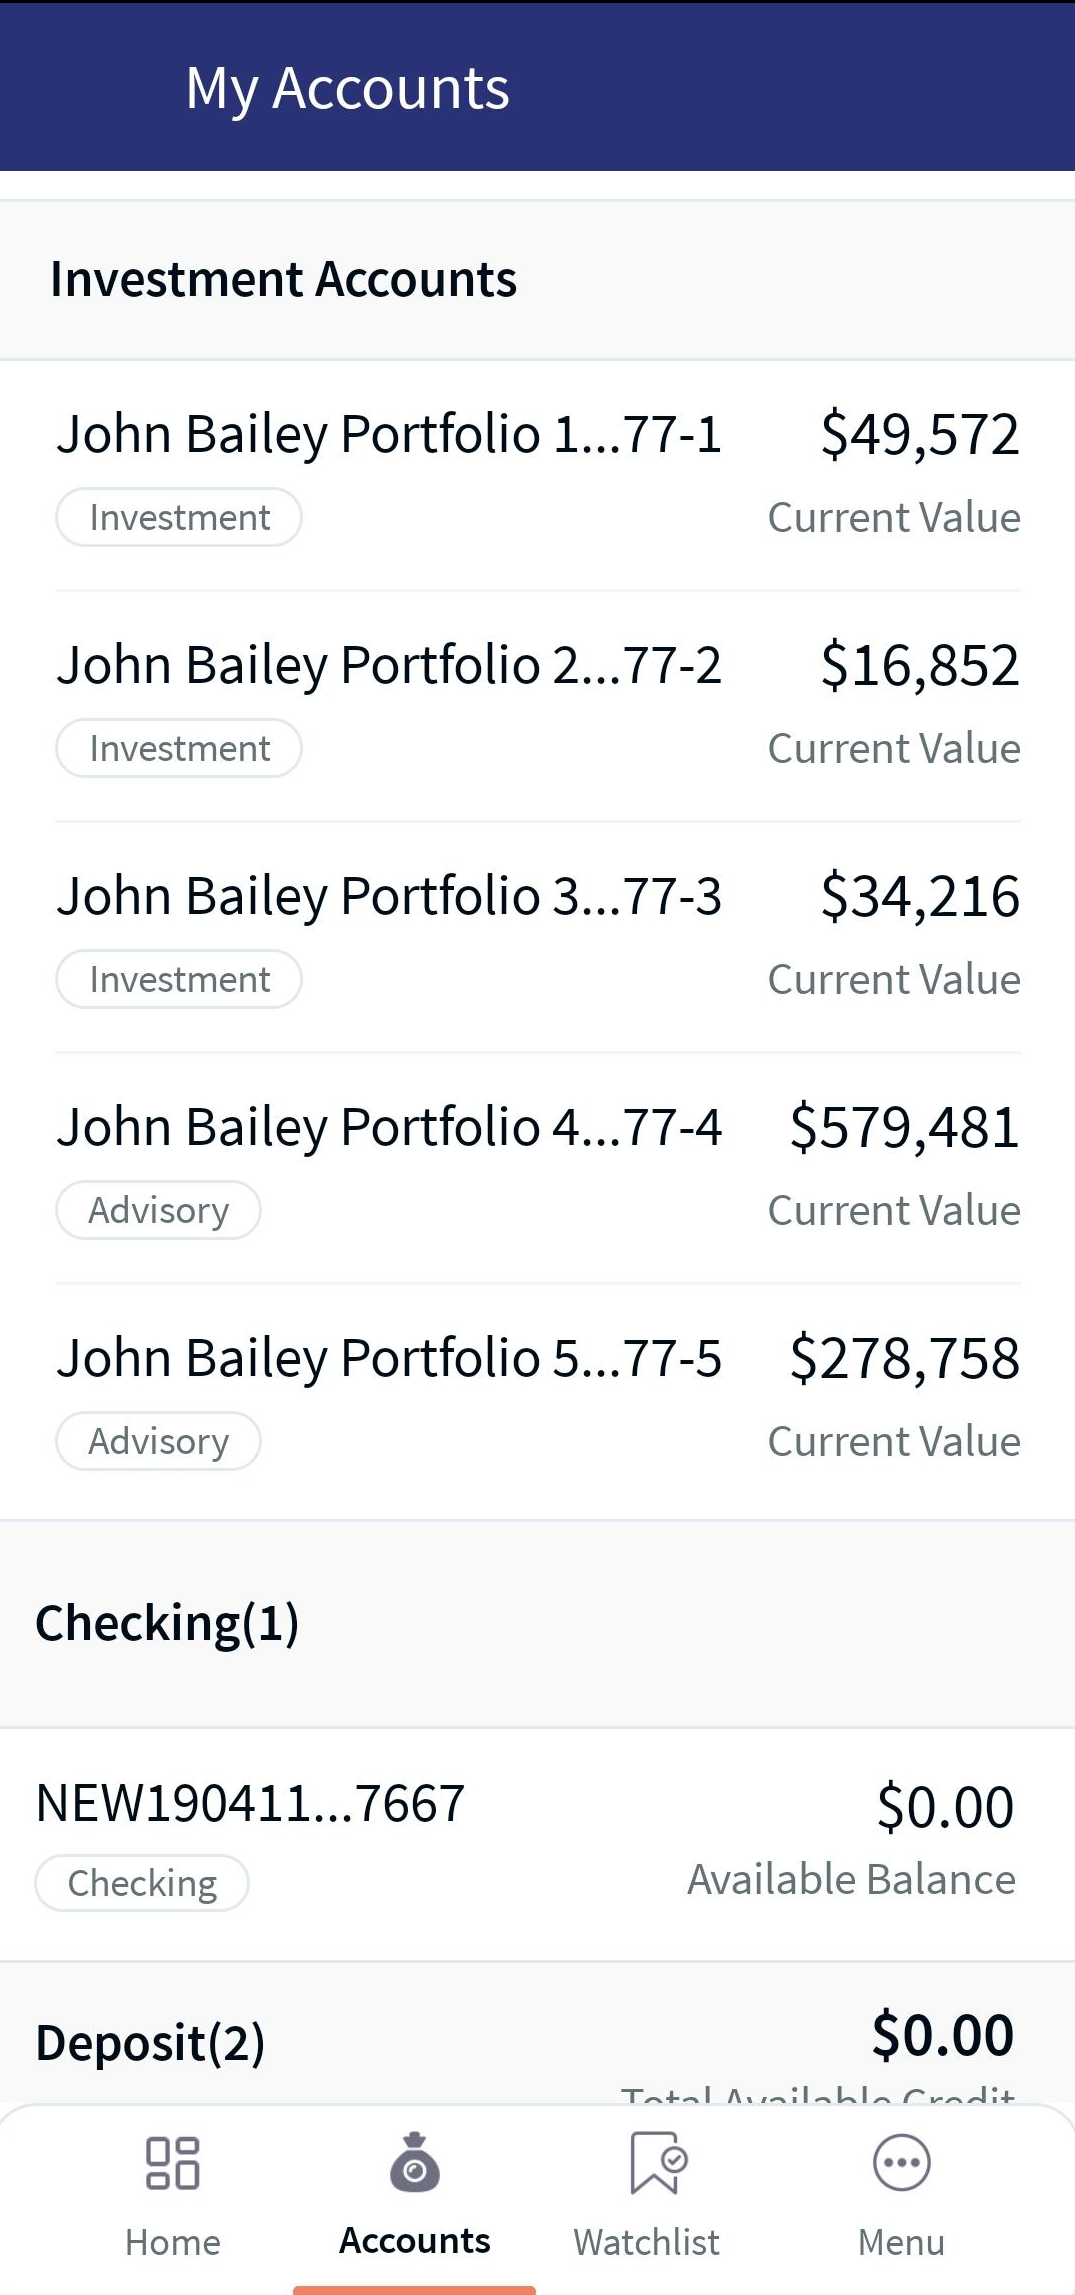
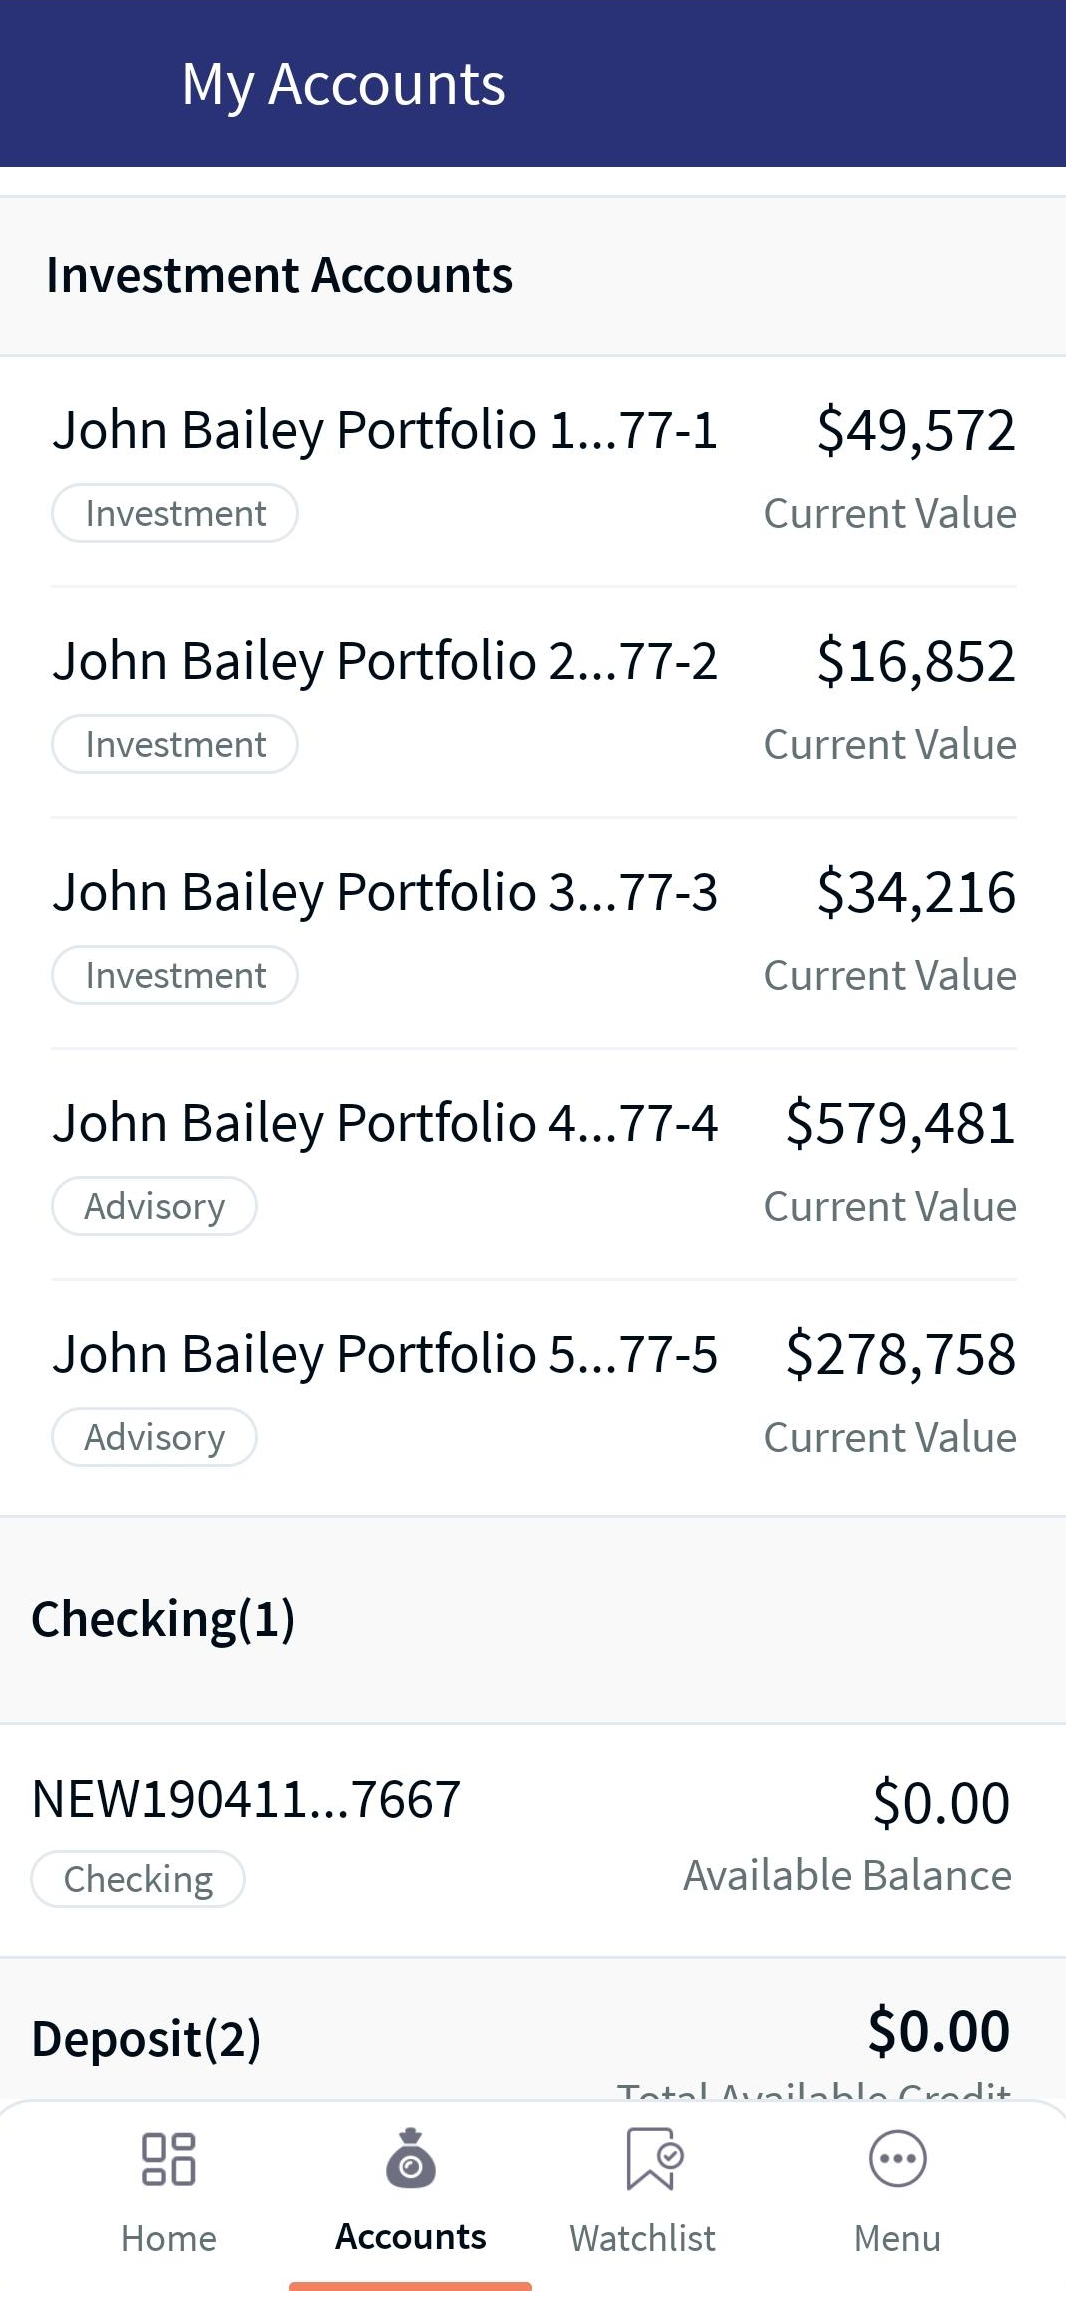
Mobile Native App: You can view the Investment Accounts in the Accounts tab. This feature displays the list of accounts, such as Savings Accounts, Checking Accounts, Credit Cards, and Loan Accounts, along with the portfolio name and ID. It also briefs about the portfolio type (Investment or Advisory). The 'Current Value' is displayed for each portfolio (without decimals).
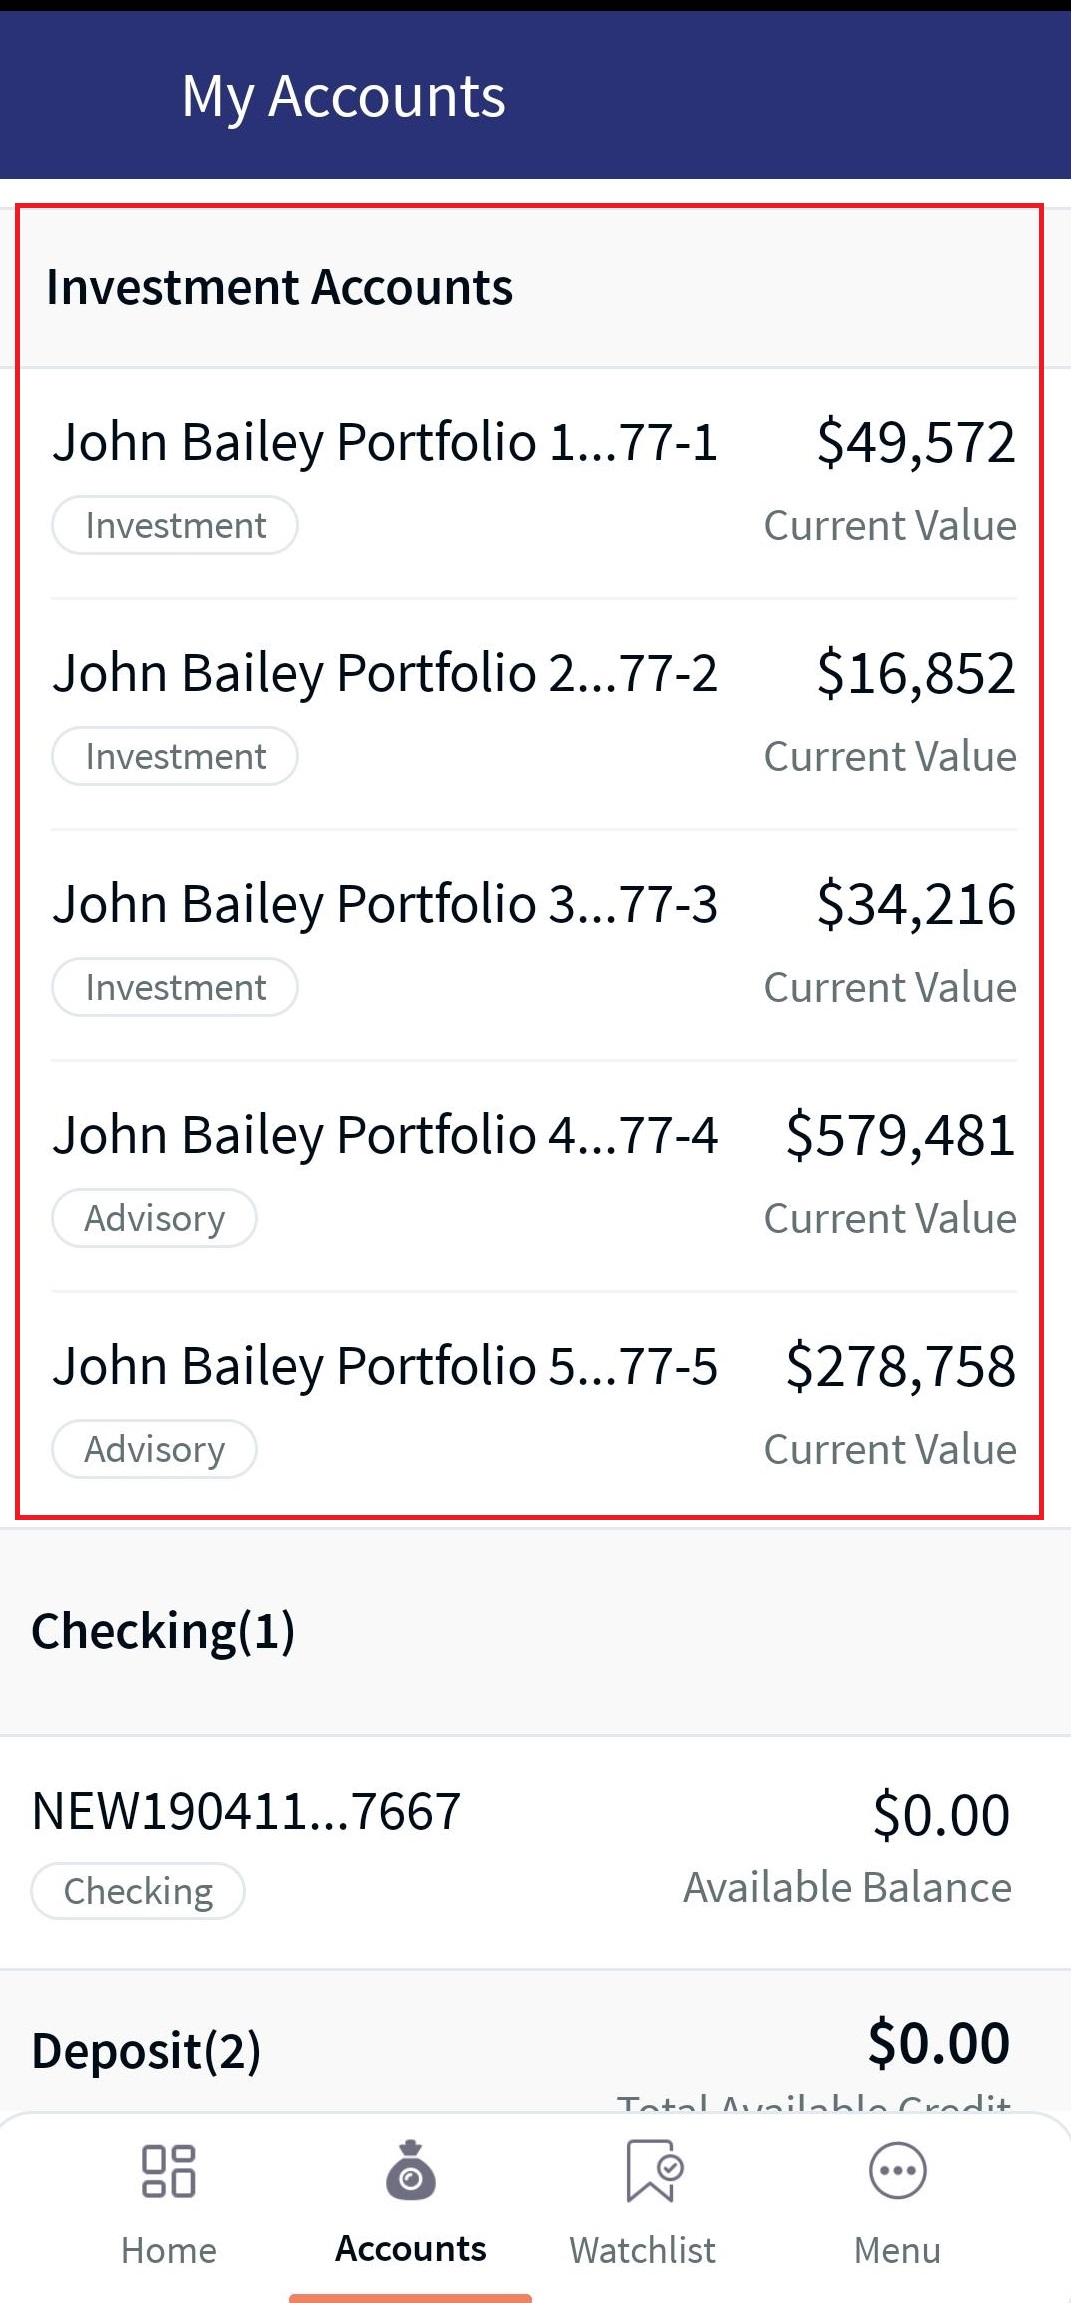
When you select and click on any portfolio, the system re-directs you to the Portfolio Details screen. For more information about a Portfolio, click here.
In this topic