Portfolio Overview
In the Digital Wealth App, managing wealth and investments has been simplified and streamlined through crafted digital experiences. This app allows you to build savings, invest, or gain deeper financial insights. Thus, it facilitates your focus on making financial management accessible, secure, and easy to use.
The Overview tab displays a consolidated overview of your investments and portfolios, allocated assets, and the Cash Accounts, displaying your cash accounts list along with the available account balance in the account currency and the portfolio reference currency.
UX Overview - Mobile Native App
The Overview section provides a comprehensive overview of the portfolio in one go.
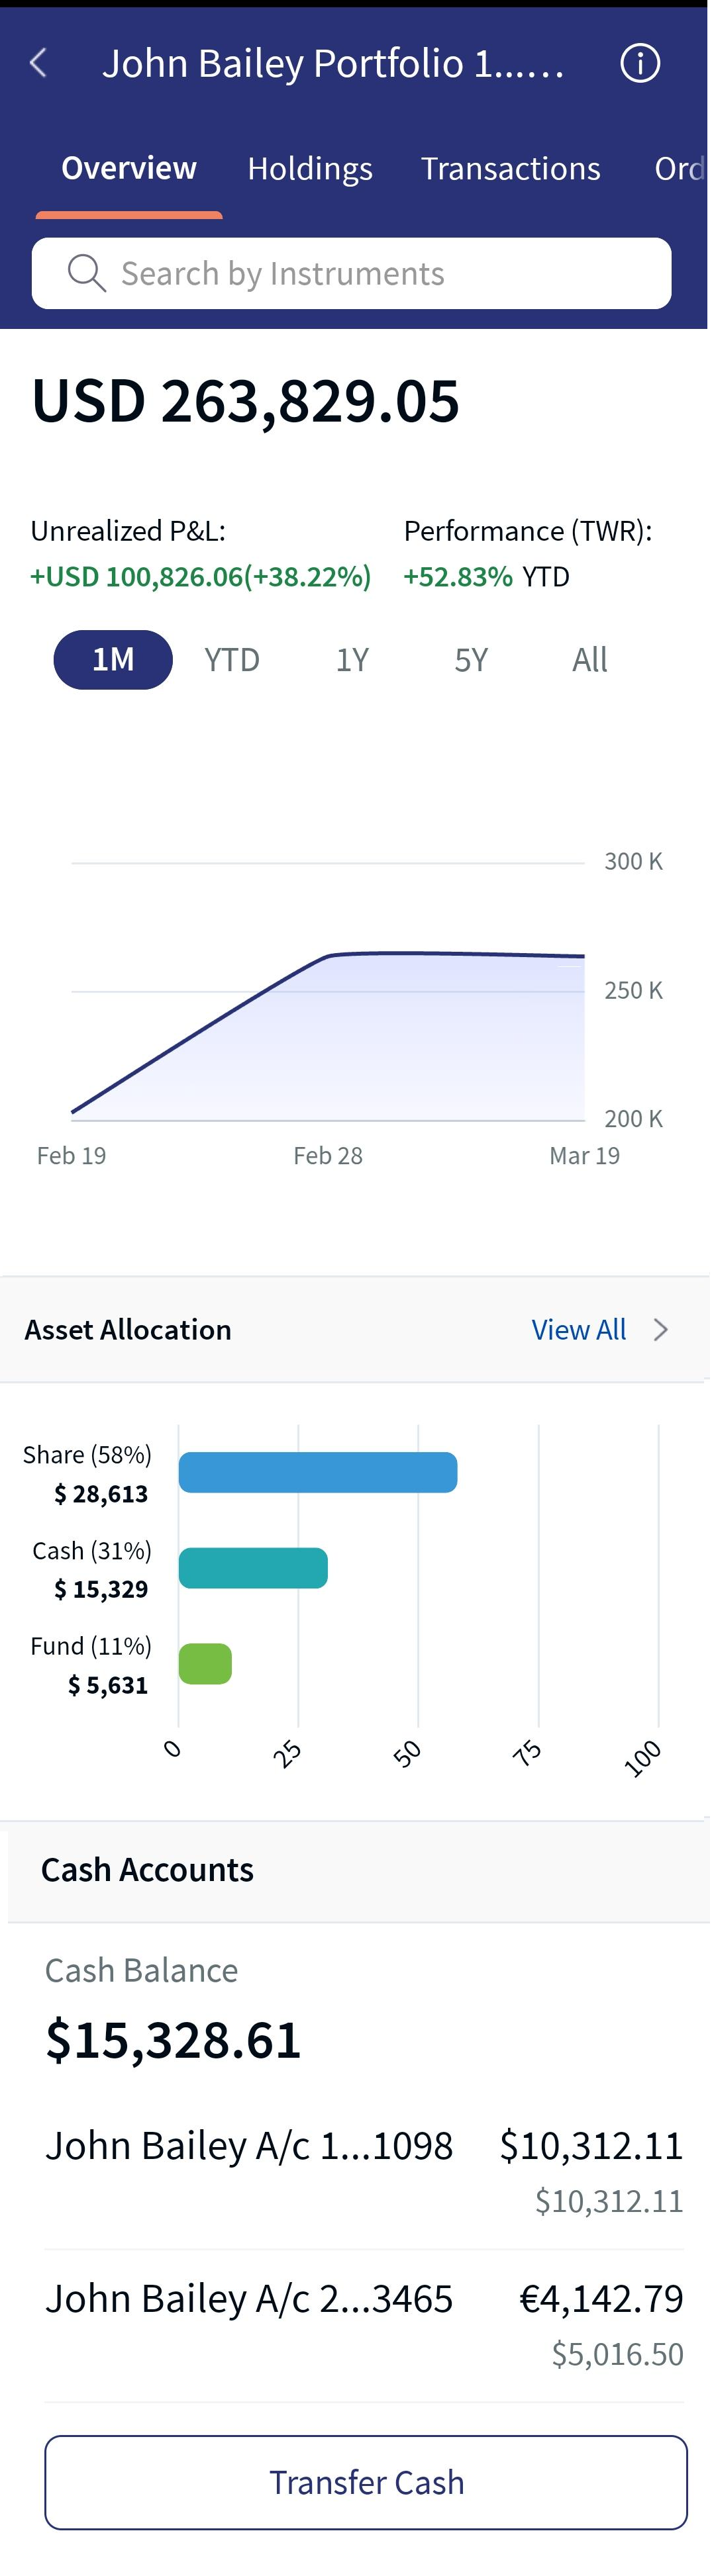
On selecting a Portfolio in the My Accounts screen, you are navigated to the Portfolio Details, where the Overview screen appears in a header tab, where the portfolio value and the YTD performance (applying TWR calculation) are displayed.
The Overview screen is categorized into the following sections:
- Search Instrument - Click here for a detailed description on how to search for an instrument. After you select an instrument, the system navigates you to the Instrument Details screen, where you can either perform Buy or Sell action. For more details on how to place an order, click here.
- Portfolio Summary - Click here for a detailed description about Portfolio Summary.
- Asset Allocation - Click here for a detailed description about Asset Allocation.
- Cash Accounts - Click here for a detailed description of Cash Accounts. After you view cash account details, the system allows you to transfer cash when you clicked on the Transfer Cash button. For more details on how to transfer the cash, click here.
This feature allows you to view the overview of the customer's investments and portfolios. You can select the time period for which you can view your investments.
Below are predefined time periods and graph intervals, which are customized and are configured as per locale.
- 1M: The graph displays the details for the last month from the current day.
- 1Y: The graph displays the details for the last year from the current day.
- YTD: The graph displays the details from the beginning of the year to the current day.
- 5Y: The graph displays the details for the last five years from the current day.
- All: The graph display the details of the portfolio from the portfolio started time.
On hovering over the graph, you can view the total value, date, and performance metric in percentage for the selected time frame.
The table below briefs about the graph intervals displayed at various integrations.
| Integrations | 1 M | 1 Y | YTD | 5Y | All |
| Mock | Daily Values | Month End Values | Month End Values | Semi-Annual Values | Semi-Annual Values |
| Wealth FO | Month End Values | Month End Values in the plotted area | Month End Values in the plotted area | Semi-Annual Values | Semi-Annual Values |
In this topic